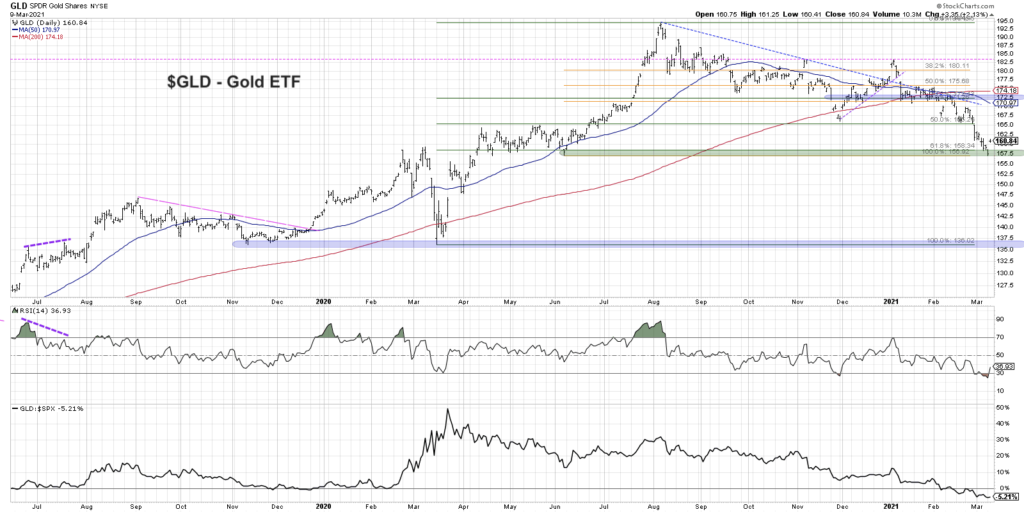
Gold has had a rough six months, with the Gold ETF (GLD) dropping 20% since peaking in August 2020. While many consider gold to be an inflation hedge, concerns about increased inflation have not manifested themselves in higher gold prices. Now that the GLD has retraced 61.8% of its 2020 bull run, it may be setting up for a further move higher out of oversold conditions.
In today’s video, we’ll use Fibonacci retracements to set a framework for the bearish trend in gold (GLD) and identify key price levels to lay out the risk/reward scenario. See chart further below for quick reference as well.
– How the “confluence of support” created by price support and Fibonacci retracements suggests the downtrend in gold may be exhausted
– What happened to gold the last time we saw an oversold condition and how the subsequent bounce failed at a key resistance level
– What may be next if gold fails to hold support at the June 2020 price level and how to properly define the risk/reward scenario
For deeper dives into market awareness, investor psychology and routines, check out my YouTube channel!
One Chart: $GLD GOLD ETF [VIDEO]
$GLD – Gold Chart
PS- Ready to upgrade your investment process? Check out my free course on behavioral investing!
Twitter: @DKellerCMT
The author may have positions in mentioned securities at the time of publication. Any opinions expressed herein are solely those of the author, and do not in any way represent the views or opinions of any other person or entity.

: Showing Some Signs of Emerging Strength")
