The stock market just keeps grinding higher and kicking bears to the curb.
To be clear, market breadth has been meh so picking stocks with strong charts has been key of late.
Today, we look at a chart of a particularly hot area of the market – technology. In particular, we are looking at a chart of the Nasdaq 100 ETF (QQQ)… and perhaps why this index may be due for a breather.
As usual, the chart is nothing too fancy. I invoke a couple of methods for finding near-term trading targets such as trend lines and Fibonacci extensions.
Note that the following MarketSmith charts are built with Investors Business Daily’s product suite.
I am an Investors Business Daily (IBD) partner and promote the use of their products. The entire platform offers a good mix of technical and fundamental data and education.
$QQQ Nasdaq 100 Chart
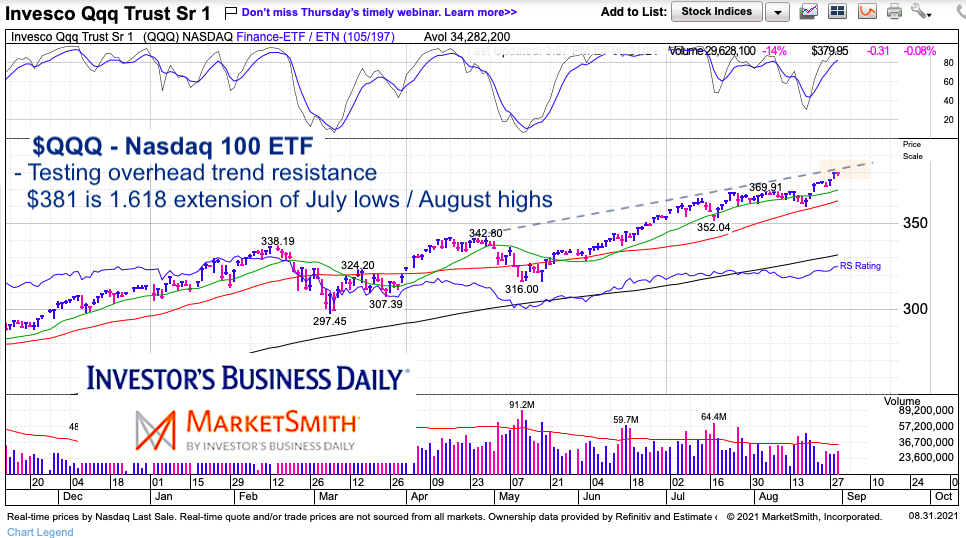
As you can see below, the Nasdaq 100 ETF (QQQ) resumed its up-trend after a spring time pause. The rally has taken the index up to an important overhead trend-line. While a confirmed breakout over this line would be very bullish, we should also be aware that this trend-line is short-term resistance and could bring a pause.
Also, using Fibonacci analysis we can see that $381 is an target area of interest. It is the 1.618 extension of the July lows and “prior” August highs (chart should say prior). Could we see a pause and refresh here? Perhaps – stay tuned.
Twitter: @andrewnyquist
The author may have a position in mentioned securities at the time of publication. Any opinions expressed herein are solely those of the author, and do not in any way represent the views or opinions of any other person or entity.
9/1/2021 3:48 pm CST – editor update noting “prior” highs in last paragraph to clarify text on chart image.

: Showing Some Signs of Emerging Strength")
