Google is one of many large cap tech stocks that may be warning of a prolonged selloff.
So far, things seem orderly. That means that we may see a correction that doesn’t necessarily seem like a “whoosh”, but that may end with a decent decline.
So why am I concerned about Google and other large cap stocks?
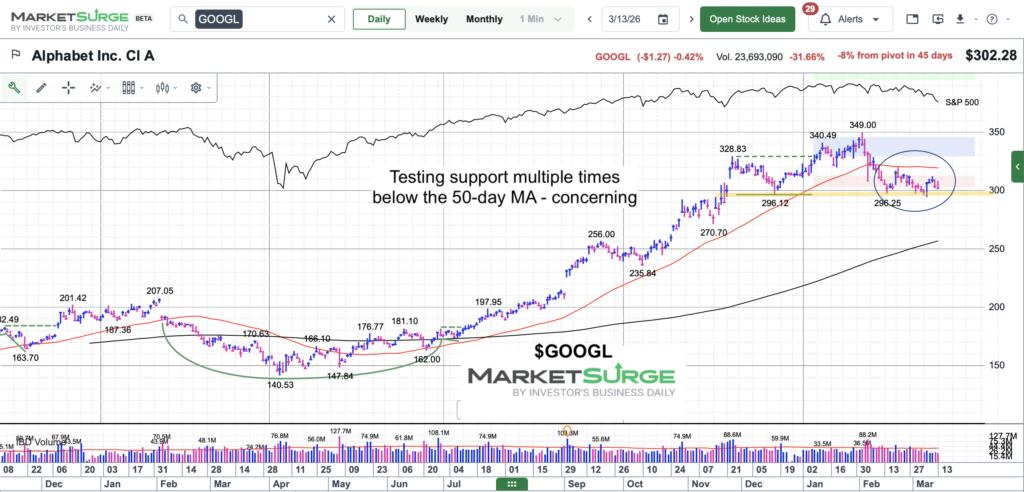
Well, many have broken the 50-day moving average and continued below it. Check out the chart below.
Note that the following MarketSurge charts are built with Investors Business Daily’s product suite.
I am an Investors Business Daily (IBD) partner and promote the use of their products. The entire platform offers a good mix of tools, education, and technical and fundamental data.
$GOOGL Google Stock Chart
As you can see, Google is trading below its 200-day MA and testing horizontal support for the fourth time. Looks a bit dicey. Stay tuned!
Twitter: @andrewnyquist
The author may have a position in mentioned securities at the time of publication. Any opinions expressed herein are solely those of the author, and do not in any way represent the views or opinions of any other person or entity.


