The Federal Reserve is meeting this week and the talk of the town is inflation. Will they raise interest rates to combat rising prices?
One of the focuses of rising prices is commodities? Soft commodities, hard commodities, energy, food, you name it has been up over the past 12 months.
BUT, things have cooled off a bit of late… just as everyone is yelling INFLATION.
Today, rather than looking at individual commodities, we go straight to a stock chart of one of the most visible miners of hard commodities – Freeport McMoRan (FCX). Perhaps Freeport can provide clues about future inflation and growth prospects.
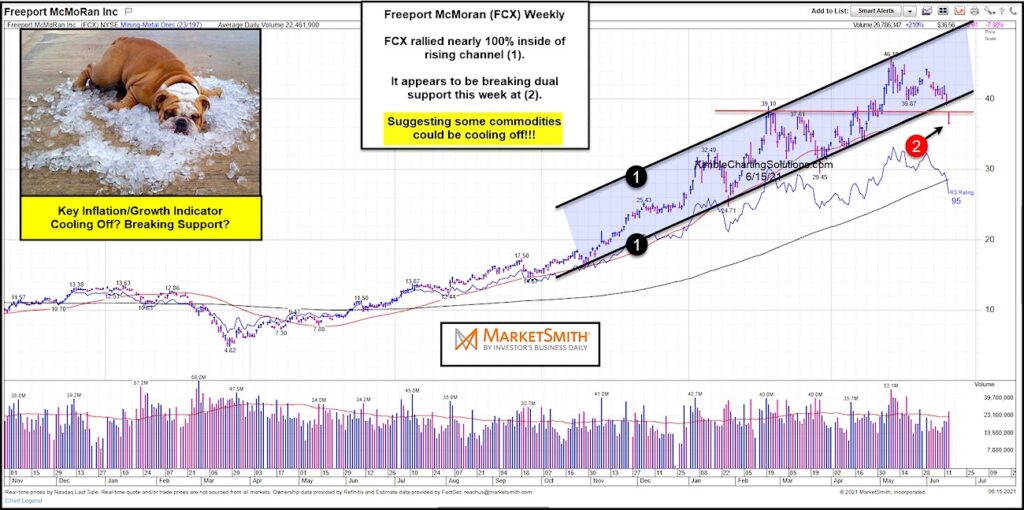
As you can see, Freeport’s stock (FCX) rallied nearly 100% inside of a bullish rising trend channel marked by each (1). But it’s stock price has struggled of late, breaking below its up-trend line and attempting to decline through important horizontal support at (2).
This important company (and commodity/inflation indicator) is on the ropes right now. Is this suggesting a cool down for select commodities and perhaps inflation? Stay tuned!
Freeport McMoRan (FCX) Chart
Note that KimbleCharting is offering a 2 week Free trial to See It Market readers. Just send me an email to services@kimblechartingsolutions.com for details to get set up.
Twitter: @KimbleCharting
Any opinions expressed herein are solely those of the author, and do not in any way represent the views or opinions of any other person or entity.


