Mining company Freeport McMoRan NYSE: FCX is enjoying the tailwind from a strong year for gold and silver prices. And although Copper prices are down, Copper has been turning up lately.
This has helped Freeport’s stock price recover in 2019 and has FCX testing a key breakout level.
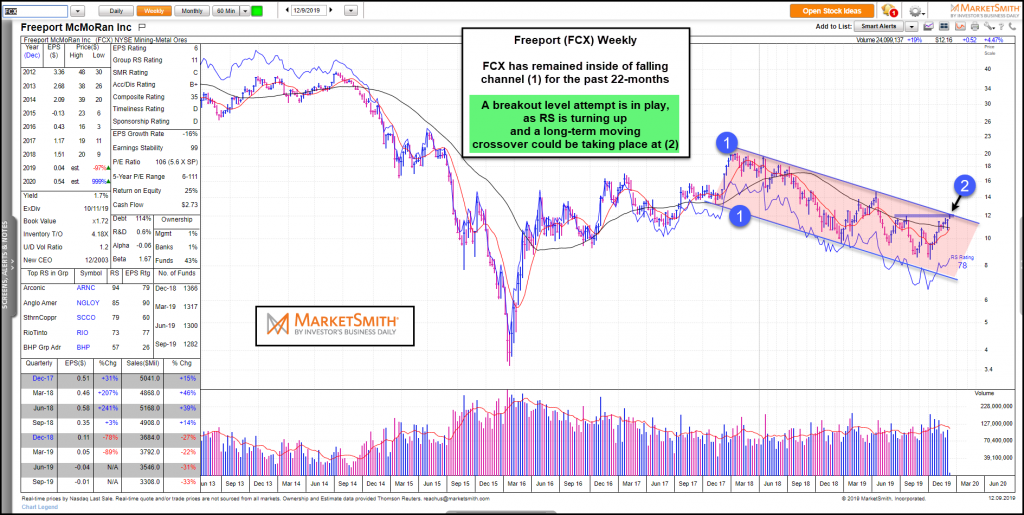
Below is a “weekly” chart of Freeport McMoRan (FCX). The shaded channel outlined by each (1) highlights the longer-term downtrend that FCX has been stuck in.
But this could change on a dime, especially if FCX can breakout above (2). This area represents its recent highs as well as its falling downtrend line.
A breakout here with strong volume would be very bullish.
It is worth noting that is Relative Strength (RS) is turning up and a moving average crossover appears to be in the works as well. Stay tuned!
$FCX Freeport McMoRan Chart
Twitter: @KimbleCharting
Any opinions expressed herein are solely those of the author, and do not in any way represent the views or opinions of any other person or entity.


