Several commodities have been on a tear higher over the past 18 months. This list of commodities includes crude oil.
As a key economic input, crude oil is more than just a tradable asset. Crude oil is an excellent indicator for the economy as well as a commodity to watch regarding inflation.
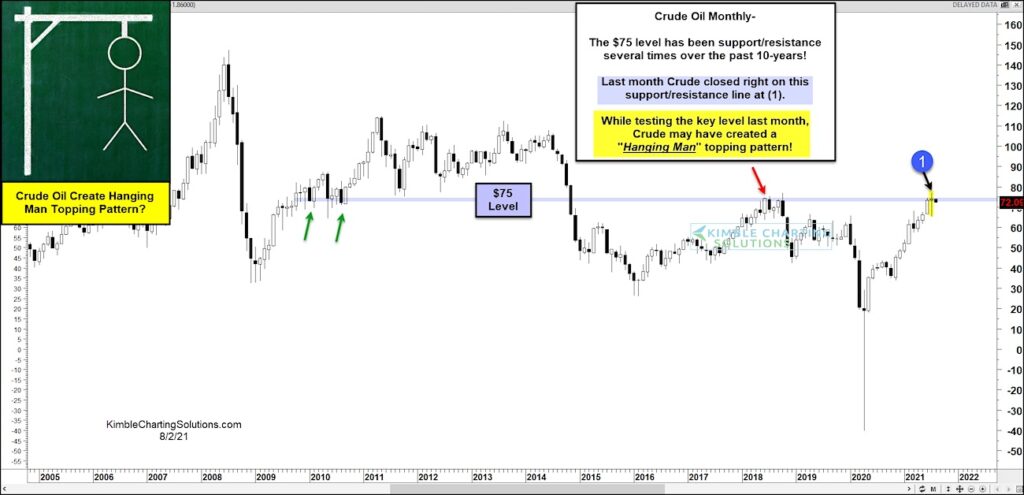
Today we look at a long-term “monthly” chart of Crude Oil futures… and why we may be at a key inflection point.
The $75 level has been support and resistance multiple times over the past 10 years. And last month, Crude Oil closed right on this key support/resistance line at (1).
But the price action also did something that could have bearish implications.
While testing this key level last month, Crude oil may have created a “hanging man” topping pattern. Any further decline this month would raise concerns of a bearish reversal pattern taking hold. Stay tuned!
Crude Oil Futures “monthly” Chart
Note that KimbleCharting is offering a 2 week Free trial to See It Market readers. Just send me an email to services@kimblechartingsolutions.com for details to get set up.
Twitter: @KimbleCharting
Any opinions expressed herein are solely those of the author, and do not in any way represent the views or opinions of any other person or entity.


