The past 12 years have seen some really big swings in the price of crude oil. And the latest swing higher into 2022 played a role in higher gas prices and inflationary pressures.
So how is the most important commodity in the world trading right now?
Let’s turn to Joe Friday for, “The facts, Ma’am. Just the facts.”
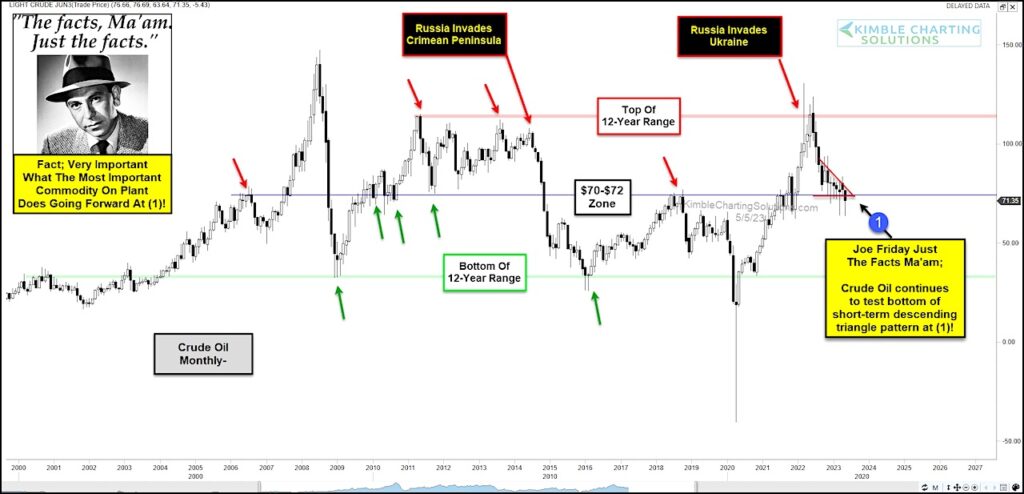
Today we look at a “monthly” chart of crude oil. Herein, you can see the wide 12 year trading range. The top has been marked by Russian invasions while the bottom has been marked by the financial crisis lows and coronavirus crash lows.
BUT, it’s important to note the middle of the trading range around $70 to $72. This area has been support and resistance on multiple occasions. And right now, crude oil is testing the bottom of a short-term descending triangle pattern at (1), which also marks mid-range trading support.
If crude oil breaks higher, it will continue in the upper half of the range… BUT if it breaks down, it could fall to the bottom of the 12 year range.
Perhaps the catalyst will be the war abroad. Or perhaps it’s a slowing global economy. Either way, it looks like the most important commodity on the planet will send an important message soon! Stay tuned!!
Crude Oil “monthly” Chart
Note that KimbleCharting is offering a 2 week Free trial to See It Market readers. Just send me an email to services@kimblechartingsolutions.com for details to get set up.
Twitter: @KimbleCharting
Any opinions expressed herein are solely those of the author, and do not in any way represent the views or opinions of any other person or entity.

 Flirting With Critical Support… Again")


