With so much turbulence in the world right now, we wanted to highlight a bearish Elliott wave scenario for the copper market, which is often seen as a bellwether for larger aspects of the economy.
On yearly and monthly time frames, copper prices correlate with oil, gold, and GDP for the world and particularly China.
We don’t mean to imply that volatility in copper price causes the corresponding economic changes, but the purpose of our style of technical Elliott wave analysis is to discover what the charts say might happen in the future. We let the charts show how the next several years can play out for copper.
The big picture:
Right now the price of copper futures is near the top of a range. The last time prices were in the same area was in 2011.
From an Elliott wave perspective, commodities spend a lot of time in corrective price patterns. With charts that span years or decades, this often manifests as three-wave moves. On the monthly chart below, you can see how we’ve been tracking a lengthy correction that we are labeling as A-B-C, with upward wave ‘B’ possibly reaching its end.
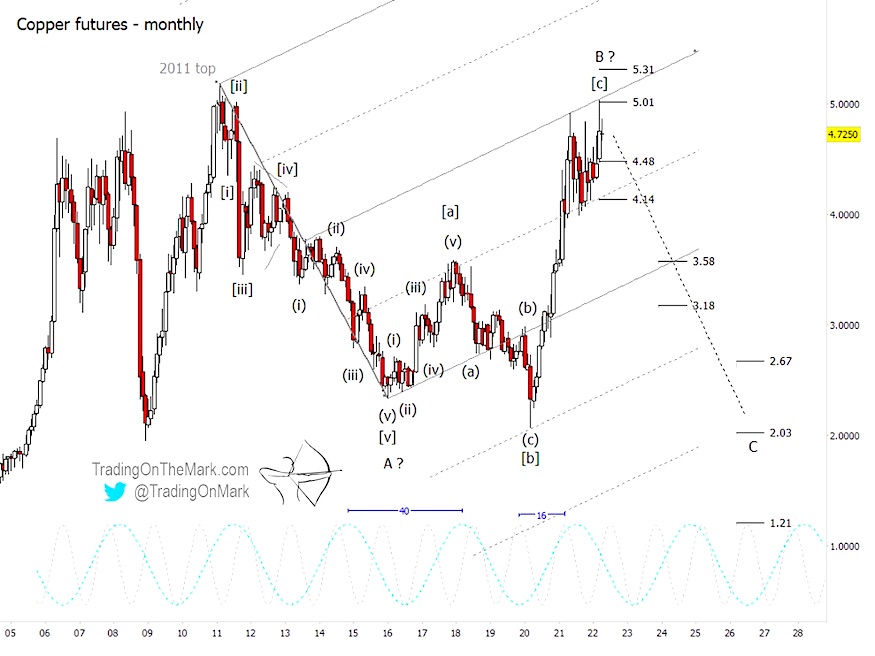
Although the labeling of the large A-B-C structure is speculative, the more important question right now is whether the sharp rally from March 2020 is complete. The support levels shown on the monthly chart assume the high is in, and we will adjust them if copper goes on to make a new high.
On a monthly chart, some arguments in favor of the high being in are:
- The recent high corresponds fairly well with the 40-month cycle peak.
- A simple geometric channel tool set to match the A-B-C count shows a nice fit with price action over many years.
- In addition to testing geometric resistance, price also appears to have been rejected at an important Fibonacci-based resistance level of 5.0135. (However there is another similar resistance line higher at 5.3136.)
On a monthly chart, copper bears who believe the high is in should watch for a solid break beneath 4.4807 as initial confirmation that the market is trying to reverse. Better confirmation will come from a monthly close beneath 4.1352.
If price continues to fall away from the recent high, the first major support occurs at 3.5764. That could also coincide with geometric support from the big channel.
Below that area, lower targets include 3.1783, 2.6720, 2.0280, and a stretch target of 1.2088. We expect downward wave ‘C’ to have a five-wave form, and those levels might guide price action during the decline.
Based on the 40-month cycle, an ideal time for downward wave ‘C’ to end would be around summer 2026.
Is the high in?
On a weekly chart, we’re tracking two competing Elliott wave variations of the big-picture bearish scenario. The most likely count is shown in red, and it has the top as being in.
A weekly close beneath 4.6204 would serve as preliminary indication that price is trying to break downward. Better confirmation of reversal will come with a solid break beneath 4.4297.
Note that the 44-week cycle high fits well with the idea of the high being in. However, we did not see a divergence signal on our preferred momentum tool with the recent high in the same way we have seen for other major turns.
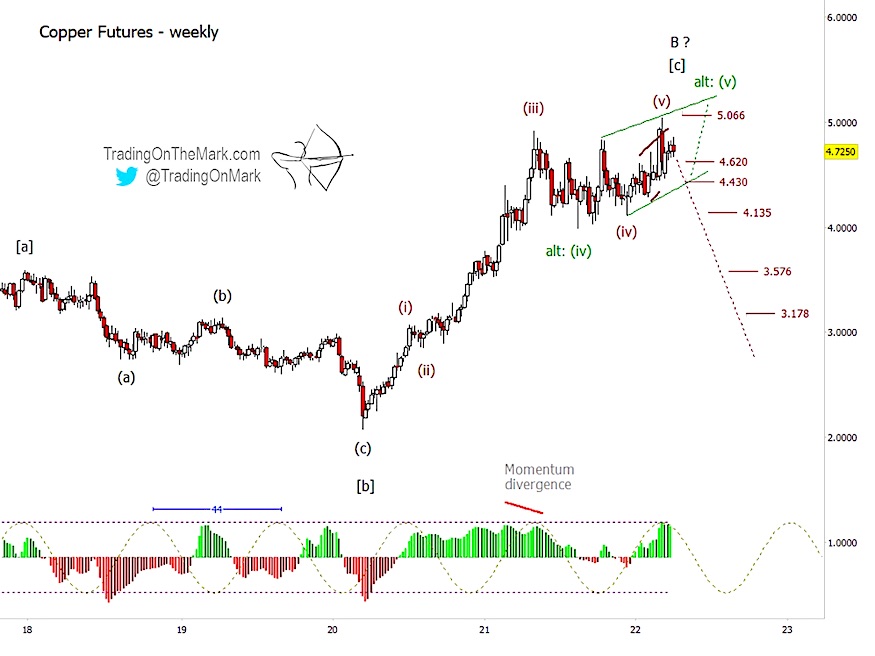
The alternative count is shown in green and is still in keeping with the overall bearish scenario. Our alternative would have copper make one more marginally higher high in the near term, perhaps after testing support near 4.4297.
The difference between our main and alternative counts is the placement of wave (iv). That choice affects how to count the apparent diagonal pattern that wends upward from each version of wave (iv).
You can get daily charts and updates for this and other highly traded markets via our subscription page on Substack and on Twitter.
Twitter: @TradingOnMark
The authors may have a position in the mentioned securities at the time of publication. Any opinions expressed herein are solely those of the author, and do not in any way represent the views or opinions of any other person or entity.


