When Doc Copper speaks, investors should listen.
And it may be that time again. The price of copper broke above the $4 mark early this year… but it’s struggled to maintain its momentum and is in a multi-month pullback.
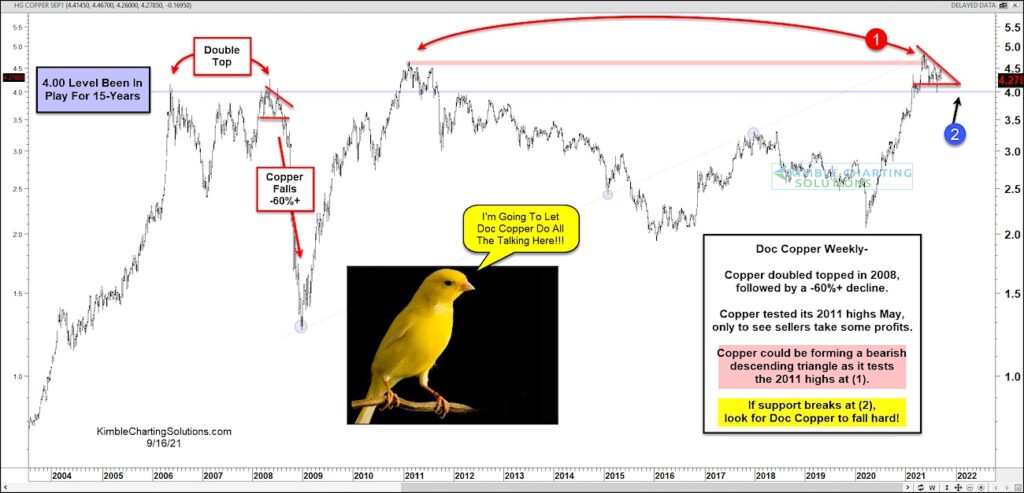
Today’s chart is a “weekly” chart of Copper. And as you can see, Doc Copper double topped just above $4 back in 2008 (leading to a 40% decline). And stocks followed the lead lower.
Copper then rose to new highs in 2011, but struggled to hold above the $4 mark. Is this happening again today?
Early this year copper tested those 2011 highs at (1) only to see sellers emerge. As well, Copper may be forming a bearish descending triangle while testing important support at (2).
If support breaks at (2), Copper may fall hard. Will Doc Copper do all the talking for the market canary? Stay tuned!
Note that KimbleCharting is offering a 2 week Free trial to See It Market readers. Just send me an email to services@kimblechartingsolutions.com for details to get set up.
Twitter: @KimbleCharting
Any opinions expressed herein are solely those of the author, and do not in any way represent the views or opinions of any other person or entity.

: Showing Some Signs of Emerging Strength")
