I’ve been watching Constellation Brands stock (STZ) for the last few weeks. The stock is strong all around, with a sound technical picture coupled with some impressive earnings numbers.
Constellation Brands earnings report on January 7th beat expectations and was very impressive with EPS and revenue well above estimates… and a bottom line jump of 15.4%. Full year 2016 guidance was also raised and the stock has been showing strong price action.
Constellation Brands stock (STZ) broke out higher above some recent resistance yesterday on the daily chart. That said, the weekly chart is what I’m watching for confirmation of the trend higher. The weekly chart of STZ is what caught my attention first and inspired me to follow this name. It displays the type of price action I typically look for when going through stock charts.
I trade weeklies using only price, volume and the ten week moving average. The fundamentals mentioned above, therefore, won’t trigger trades for me. Although I like having strong fundamentals to back up a solid technical set-up, price is king when it comes to pulling the trigger.
Price is what gets me in and out of a trade and I like it to line up across multiple time frames. Volume is also an important part of my process as it precedes price and can also signal how much liquidity is in a stock. The next time you’re considering buying a stock based on its price action, take some time to also check out its weekly volume. It’s generally a positive sign when the number of weeks in which the stock closes up on above average weekly volume outnumbers the weeks in which it closes down on above average volume.
Okay, now let’s take a look at some charts for Constellation Brands stock and see why a rally may be setting up.
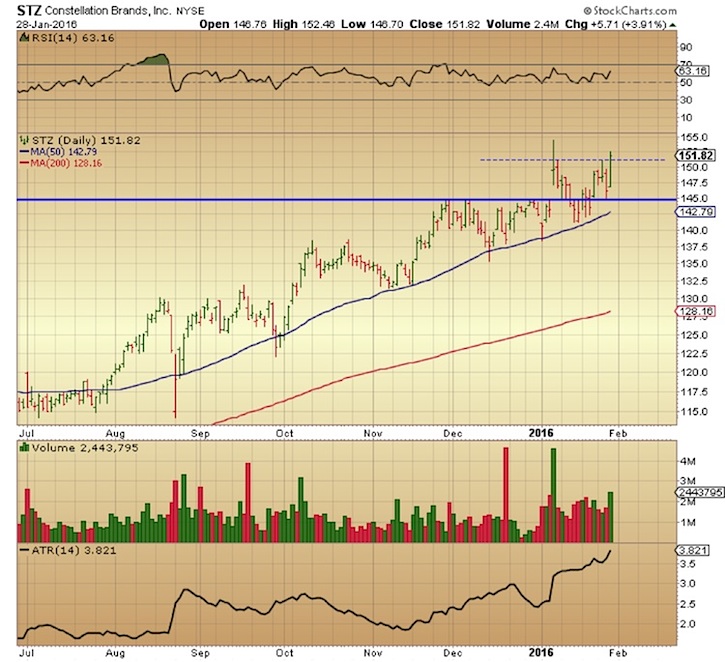
On the daily chart below, we can see the stubborn resistance mentioned earlier at the $151 level where the stock stalled on several occasions in the last three weeks. It finally managed to break higher and close above it yesterday with a nice increase in volume. Yesterday’s close was also at all time highs (on a closing basis). The next resistance level is the intraday all time highs of $154.31 set on January 4th. A breakout above this level on volume would definitely get me interested as it would confirm the strength behind today’s breakout.
As mentioned earlier, the weekly chart is actually what caught my attention here. I love charts like this as they have all of the characteristics that I look for. Looking at the chart below for Constellation Brands stock, it shows a series of five substantial volume spikes, some relative and some absolute, on days where price reclaimed or successfully back tested the 10 week moving average. It’s very simple and clear cut. Volume doubled or tripled on back tests or upward breaches of the ten week line, leading to five rallies ranging from 21 percent to upwards of 45 percent since mid 2012.
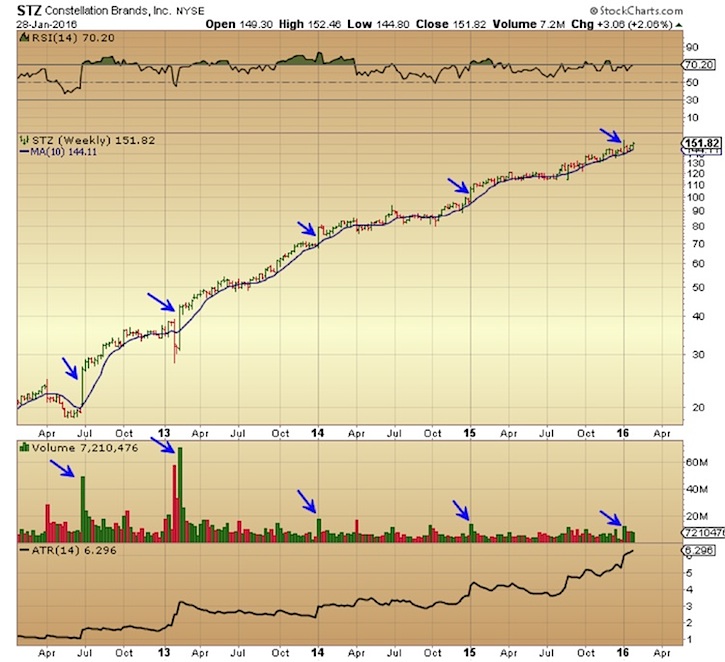
In the short term, the stock has been above the ten WMA every week except one since Oct. 5th and has held up very well in the extended market chop we’ve seen since August. One of the advantages of trading weekly charts is their ability to drown out the noise of daily or intraday price moves, allowing you to give price time and to eliminate emotional, knee-jerk decisions from your trading process.
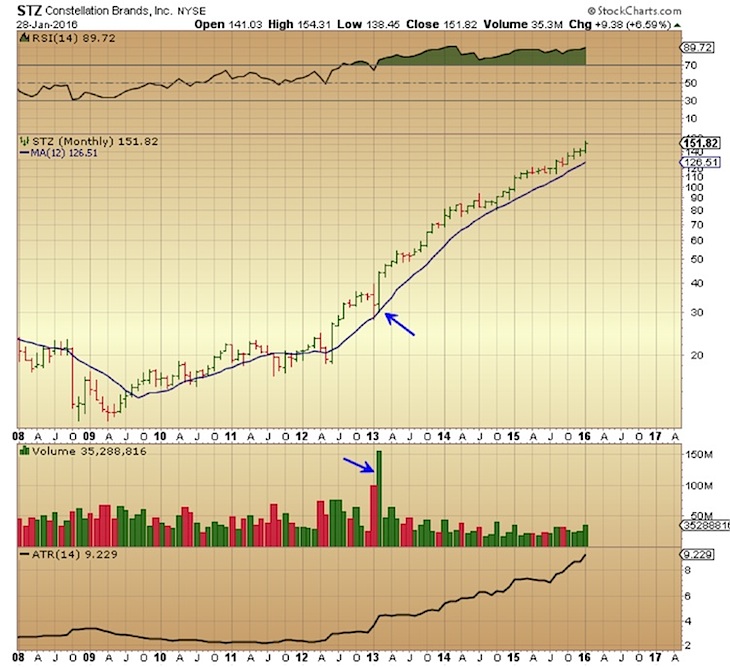
The monthly chart for STZ is solid as well. The last close below the 12 month moving average was way back in May 2012. Constellation Brands stock took off with record volume on Feb. 1st, 2013 and has never looked back. You would have no idea of the volatility the markets experienced in the last 6 months by looking at STZ’s monthly chart. The only time it even back tested the 12 month MA was October 2014 – that’s quite a strong rally!
Although I trade mostly weekly charts, I do use dailies and monthlies as guides. Daily and intraday charts can show me when price is approaching a trigger point in the short term, which alerts me to begin closely monitoring the weekly. Yesterday’s break of the $151 level on the daily was one such sign.
As I’ve explained in many of my previous blog posts, it takes time and patience, as well as the ability to sit on your hands for protracted periods of time, in order to wait for trades to materialize on weekly charts. Constellation brands stock showed strength yesterday with a close above a recent supply level on the daily.
I’m not ready, however, to get long just yet. I’ll now need to see some follow through on the daily and confirmation on the weekly to get involved. Also, although it’s not shown in the chart, price is now above its Bollinger bands on the daily which can warrant some caution in the short term. If the market cooperates, and that’s a big “IF” in view of recent volatility, and recent strength continues, STZ may make for a good long in the weeks to come.
Thanks for reading.
Twitter: @DDCapitalFund
The author does not have a position in the mentioned securities at the time of publication. Any opinions expressed herein are solely those of the author, and do not in any way represent the views or opinions of any other person or entity.


