I am a huge fan of Cathie Wood. I am also an ardent critic.
Why?
She does not use any type of risk management.
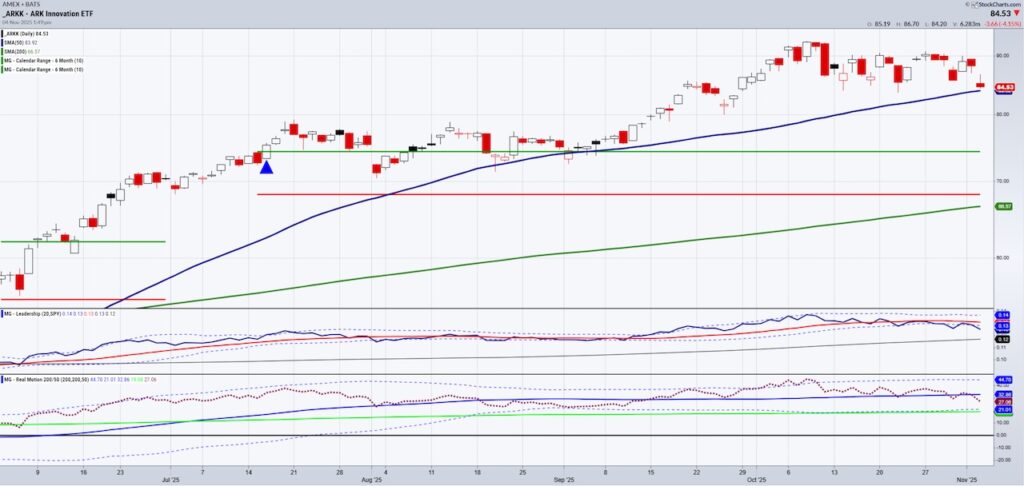
She has vision for sure, but just look at the peak to trough and current price levels for the ARK Innovation ETF (BATS: ARKK):
- ARKK peaked in 2021 at $160.
- The trough was in October 2023 at $33.76.
- Since then, the stock basically traded within a trading range from $40 to about $65.
- This year, ARKK cleared the trading range, posting a recent high price at $92.65.
From peak to trough, Cathie sat through losses of over 70%.
Currently, the loss from the peak is still about 40%.
Why are she and her fund a good barometer?
Because the ETF holds Mag 7 stocks and social disruptors.
Here are the top holdings.
| Holding | Ticker | Approximate Percentage of Portfolio |
| Tesla, Inc. | TSLA | 12.71% |
| Roku, Inc. | ROKU | 5.90% |
| Coinbase Global, Inc. | COIN | 5.66% |
| Tempus AI Inc | TEM | 5.00% |
| CRISPR Therapeutics AG | CRSP | 4.93% |
| Robinhood Markets Inc | HOOD | 4.83% |
| Shopify Inc | SHOP | 4.75% |
| Palantir Technologies Inc | PLTR | 4.53% |
| Advanced Micro Devices Inc | AMD | 4.35% |
| Roblox Corp | RBLX | 3.84% |
Up until today, ARKK looked like it could head to $100 per share.
Instead, Palantir sold off after solid earnings. Shopify did as well.
Robinhood reports after this Daily is written.
I love Crisper, but do not own the stock because it has yet to clear a key monthly moving average.
The bigger point is ARKK lives for fundamentals and cares little for technical analysis.
Over the long term, we love the stocks in her fund.
We own some (AMD TEM PLTR COIN) and have made profits along the way.
Some we do not own but are watching.
We use market timing and risk management regardless of how well we expect a company to perform in the future.
So why is the ARKK fund a great barometer on whether we are beginning a bigger meltdown or just a normal correction?
Look where the price is on the Daily chart.
Right above the 50-DMA (Daily moving average).
Remember, in recent posts, I talk a lot about the 50-DMA.
Granny Retail XRT has traded below for 19 days.
Regional Banks KRE have for even longer.
Transportation IYT flirts with its 50-DMA.
Since ARKK holds so many growth stocks, that 50-DMA is huge.
What has held up the market?
AI/Growth/Mag 7.
Should ARKK convincingly break the 50-DMA for 2 consecutive days, get ready for a much bigger correction all around.
Of course, continue to watch our Transportation sector IYT.
Furthermore, should ARKK hold the 50-DMA and pop from here, we would expect the market to regain footing.
Twitter: @marketminute
The author may have a position in mentioned securities at the time of publication. Any opinions expressed herein are solely those of the author and do not represent the views or opinions of any other person or entity.

: Showing Some Signs of Emerging Strength")
