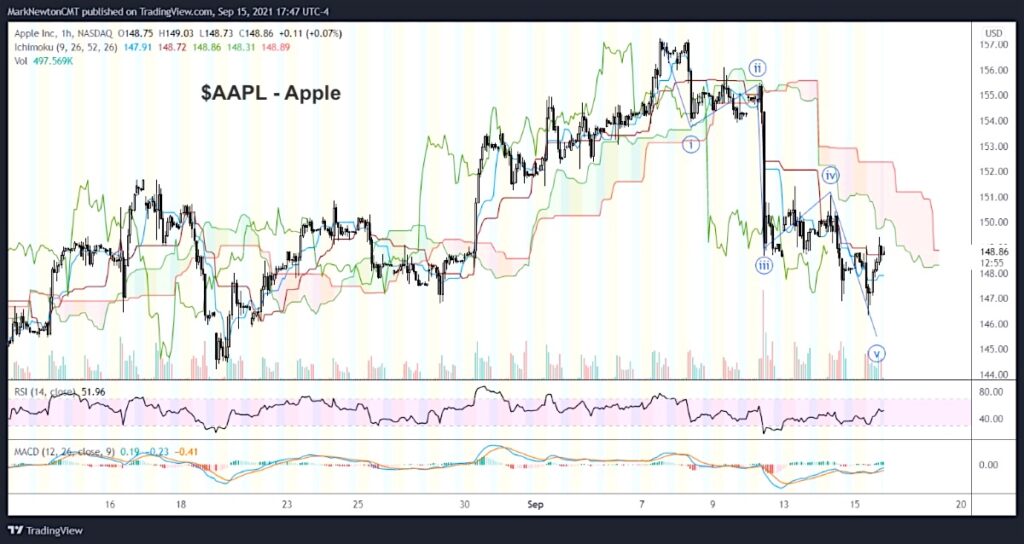
Apple’s stock price (AAPL) has been under pressure over the past couple of weeks.
And the decline appears to have unfolded in 5 waves down. That is negative from an Elliott wave perspective. Could this be a sign that a larger top is taking shape for AAPL?
Many Elliott wave practitioners have been discussing this non-stop in the last 24 hours. From my perspective, I see a near-term low initially into Monday/Tuesday around 144-146, so the downside from a short-term trading perspective looks minimal. However, these types of patterns typically give way to rallies which can retrace 50 to 62% of the prior decline before failing and giving way to additional weakness.
This pattern specifically gives me some confidence that a near-term cyclical low for the stock indices is approaching, but that rallies back to try to test highs will prove sellable into late September.
So how the coming retracement rally plays out will be telling… Put this setup on your radar.
If you have an interest in reading more thorough technical research twice a day, please visit NewtonAdvisor.com. Additionally, feel free to send me an email at info@newtonadvisor.com and I’d be happy to send you copies of recent reports or add you to a trial of my work. Individual and Institutional clients are shown pre-market thoughts on several markets and asset classes, mid-day thoughts and long/short ideas at @MLNewtonAdvisors (private Twitter). Email for details.
Twitter: @MarkNewtonCMT
The author may have a position in mentioned securities at the time of publication. Any opinions expressed herein are solely those of the author, and do not in any way represent the views or opinions of any other person or entity.


