Just as tech stocks lead on the way up, they have lead on the way down. And it hasn’t been a particularly pleasant decline.
It’s been a bear market. The Nasdaq has fallen over 30% and well known large cap stocks have plummeted.
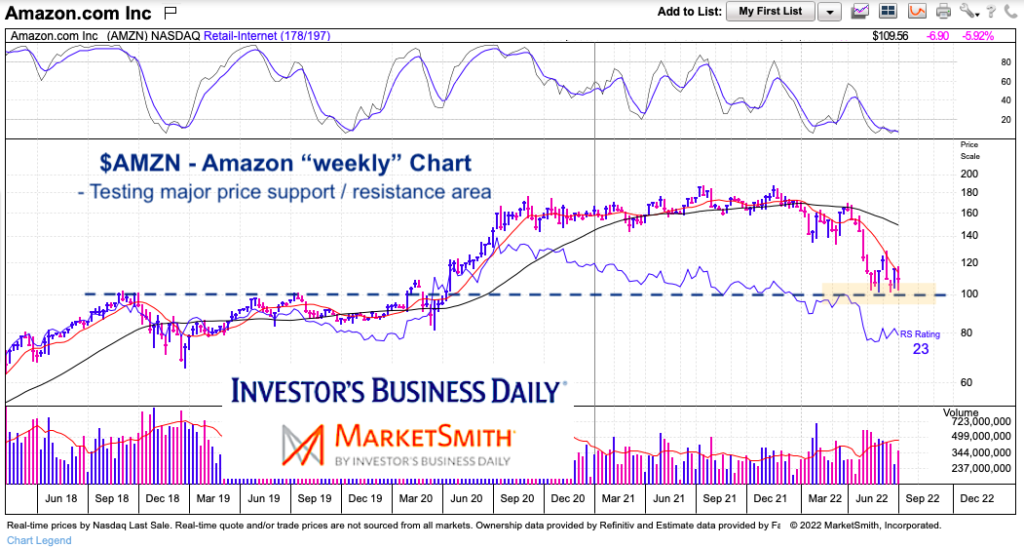
One such stock is Amazon (AMZN). After peaking at $188, AMZN has fallen down to the $100 level, and is currently trading just above that level.
Today, we take a wide angle view and share why Amazon may have fallen into the bounce zone.
Note that the following MarketSmith charts are built with Investors Business Daily’s product suite.
I am an Investors Business Daily (IBD) partner and promote the use of their products. The entire platform offers a good mix of analysts, education, and technical and fundamental data.
Amazon Stock Price Chart – “weekly”
Once again, we simply share the chart and let price talk. Looking at AMZN, we can see that a distributive top formed over the course of 20 months and price has broken down from that. This leaves significant overhead supply (areas where one could expect sellers).
Knowing this, a longer-term investor would need to be cautious and selective in accumulating shares over a longer time period. And while a shorter-term trader would need to do the same, the likelihood of a tradable low soon is higher than a durable low. The chart below shows the $95-$100 area as prior resistance that has now become important support. This is the area I am watching over the coming days/weeks and wouldn’t be surprised to see a nice bounce develop from.
Twitter: @andrewnyquist
The author may have a position in mentioned securities at the time of publication. Any opinions expressed herein are solely those of the author, and do not in any way represent the views or opinions of any other person or entity.

: Showing Some Signs of Emerging Strength")
