At some indeterminate point in the recent past, Yahoo! (symbol: YHOO) became something more than the Google era’s best Walking Dead homage to Internet Search.
Admittedly, I don’t remember when Marissa Mayer became CEO alright, I looked – July 17, 2012. YHOO: $15.67; but the date isn’t necessary: YHOO’s chart elegantly and tersely encapsulates the optimism Mayer’s accession to the helm has inspired over the slowly fading Internet company’s future. To wit, over the past 12 months YHOO has appreciated +70.4%, destroying the wider NASDAQ (Symbol: QQQ) over that period by 54%, and handily outperforming narrower measures such as the Dow Jones Internet Index (symbol: FDN) and Powershares NASDAQ Internet Index (symbol: PNQI) by ~30%.
According to the market’s ongoing assessment, this out-performance looks set to continue; but just as Yahoo’s stock price pushes to into territory last seen in late 2007, it looks like tougher work and the first substantial Yahoo stock correction in two years may lie ahead.
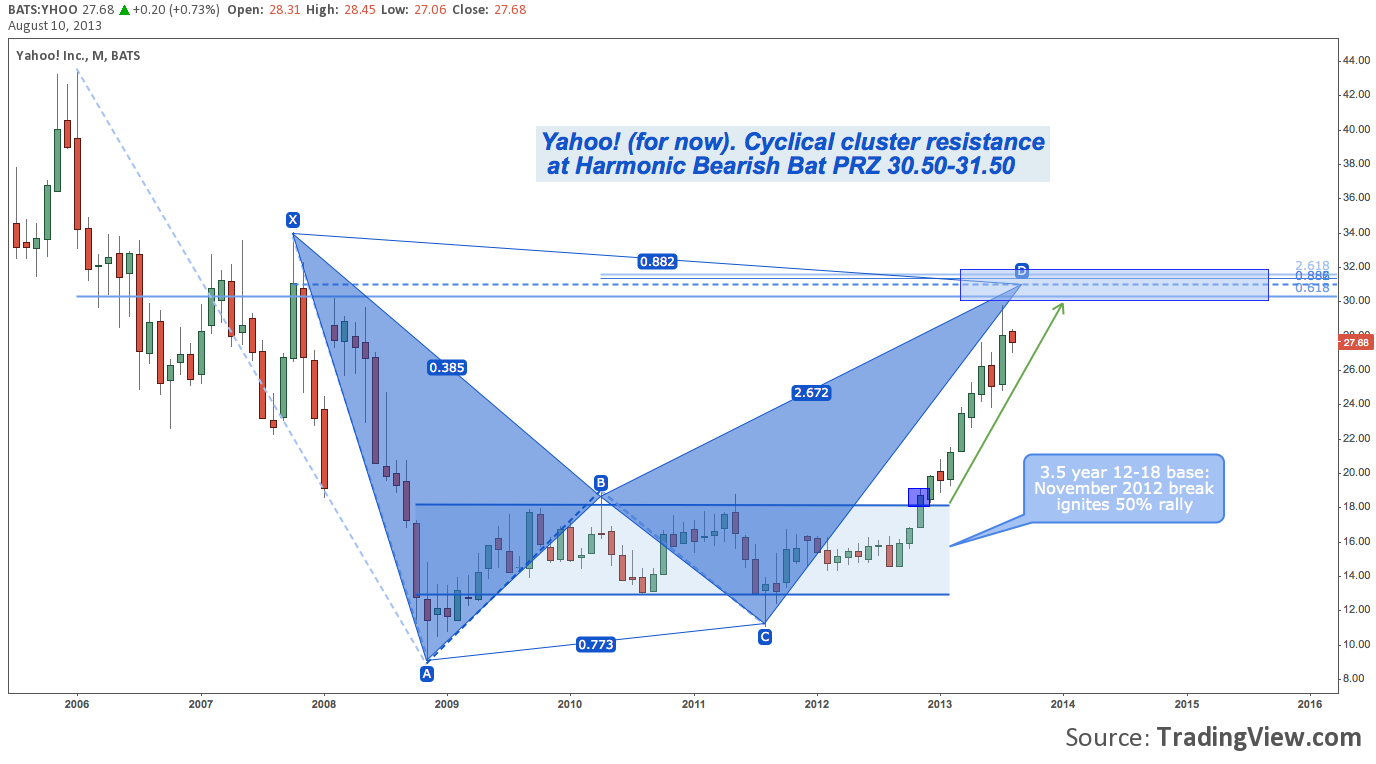
Yahoo! (YHOO) – Monthly: Harmonic Bat (Bearish)
Impressively, YHOO has been steadily plowing through a broad congestion zone between 24-32 that prevailed between May 2006-October 2008. For most – 3.5 years – of the recovery period that followed, while the wider market posted impressive gains, YHOO stagnated between 12-18. Then last fall as US stocks bottomed in mid-November, Yahoo’s stock began participating in earnest; and has yet to look back. Now technical grounds are building to suppose the first pullback of real note is soon to occur.
In virtue of the rally staged since November 2012, the last 6 years have an entirely new technical context: YHOO is exhibiting a harmonic Bearish Bat pattern with a potential reversal zone (PRZ – light blue rectangle) between 30.50-31.50.
Yahoo! (YHOO) – Daily: Rising Channel and Bull Flag
Zooming in on the rally off last November’s low, YHOO moved higher in narrow, uniform fashion, adding nearly 60% through early May. On May 7, the stock gapped above rising channel trend line resistance to open at 26.01, followed by sideways consolidation until May 23’s gap-down brought it back into the channel, making a lengthy Island reversal pattern out of the intervening period. Then on July 17, the stock installed a breakaway gap over mid-May resistance and out of the rising channel; only to give it back 4 sessions later after another gap down and creation of a second island reversal.
Once again nearing the bottom of its rising channel and effectively unchanged since mid-May, YHOO has demonstrably proven its inability to kick out a momentum-driven break into higher gear on persistent volume. These failures don’t signal that the stock’s rally is over; but its reflexive failures to realize aspirations to greater things (i.e. a more aggressive up-trend) do suggest the current leg is growing tired and a Yahoo stock correction may reasonably follow. (click image to zoom):
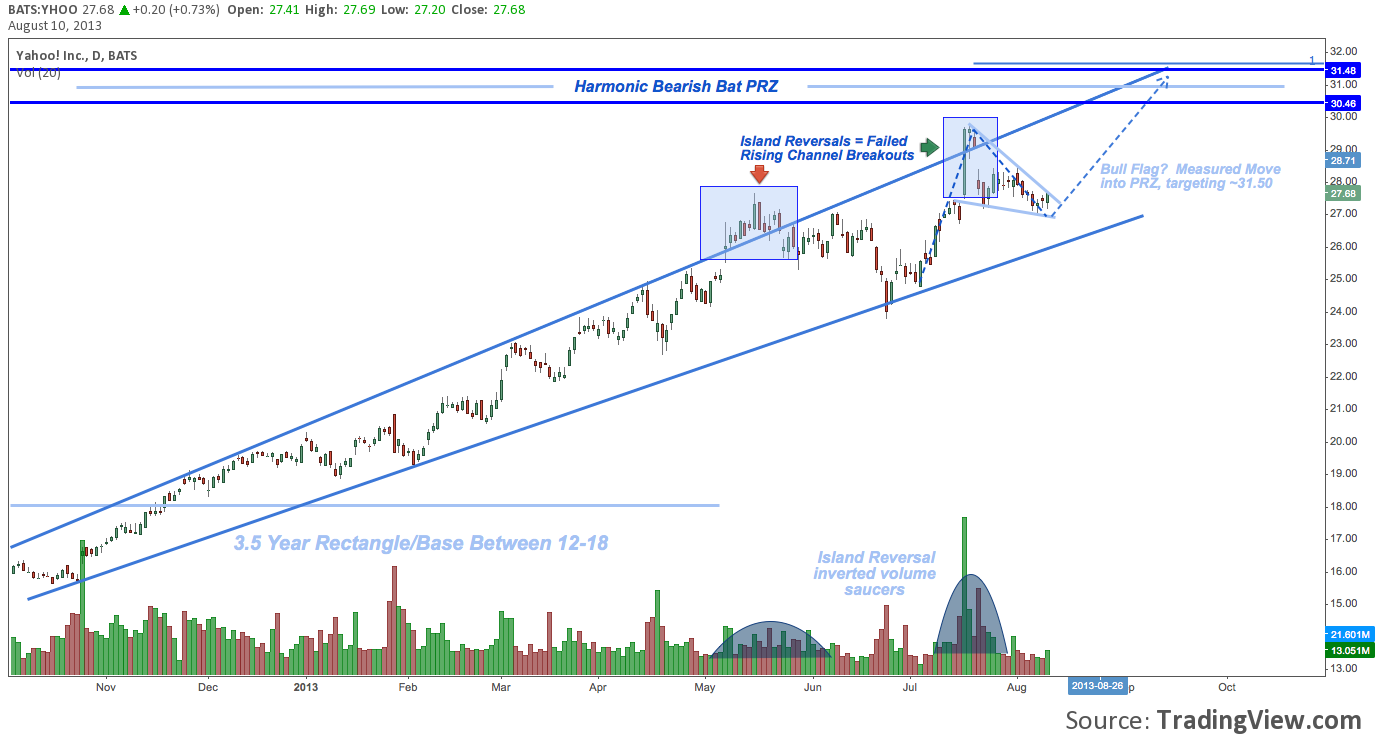
The move off the mid-July high may have positive short-term implications, though: a bull pennant has formed that is about to wind out, projecting a measured move if it breaks higher to $31.50, a level it hasn’t printed since November 2007. This aligns well with a solid test of the larger Bearish Bat PRZ between 30.50-31.50 from which a deeper Yahoo stock correction may then commence.
Twitter: @andrewunknown and @seeitmarket
No position in any of the mentioned securities at the time of publication.
Any opinions expressed herein are solely those of the author, and do not in any way represent the views or opinions of any other person or entity.


