The past month has seen the US Dollar strengthening and interest rates returning to elevated levels.
This has ushered in a bit of volatility for U.S. equities. And a continuation of this trend could solidify a pullback / correction.
That said, I believe a combination of a stronger Dollar and strong interest rates may hit Emerging Markets (EEM) even harder. And today’s charts show why it is worth watching right here, right now.
Note that the following MarketSmith charts are built with Investors Business Daily’s product suite.
I am an Investors Business Daily (IBD) partner and promote the use of their products. The entire platform offers a good mix of tools, education, and technical and fundamental data.
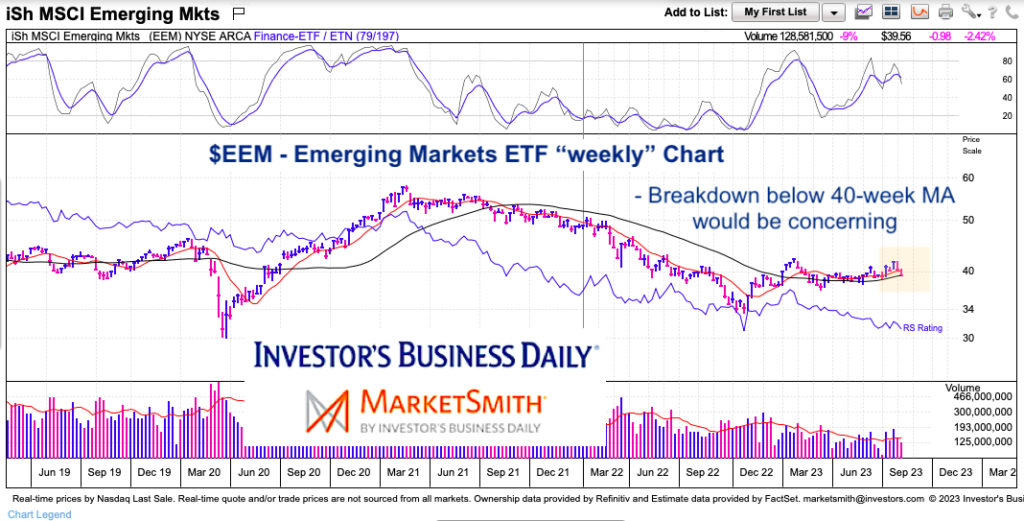
$EEM Emerging Markets “weekly” Chart
Pretty simple long-term chart. As you can see, price is sitting on the 40-week moving average. A weekly close below this level would concerning.
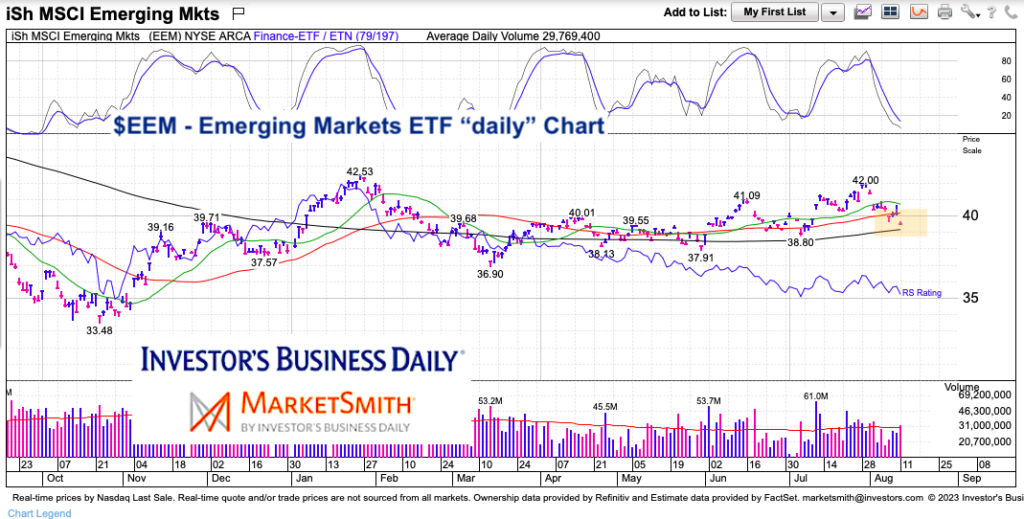
$EEM Emerging Markets “daily” Chart
Same sort of thing on the near-term chart. We can see that EEM has broken below its 20/50 day moving averages. Things would get even more concerning if EEM breaks below its 200-day moving average (now support) — especially if we see follow through selling below that level. Put it on your radar.
Twitter: @andrewnyquist
The author may have a position in mentioned securities at the time of publication. Any opinions expressed herein are solely those of the author, and do not in any way represent the views or opinions of any other person or entity.


