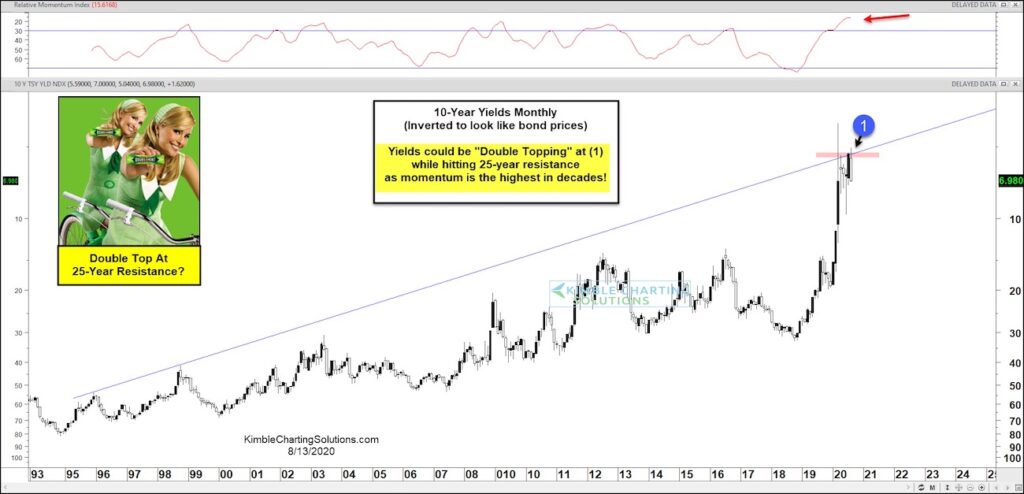
10 Year US Treasury Bond Yield (Inverted!)
Treasury bond yields sunk during the early days/weeks of the coronavirus pandemic.
And they have yet to recover. But that could be changing soon.
In today’s chart, we look at 10-year US Treasury Bond Yields (they are closely followed and help to dictate mortgage rates). Note that today’s chart is inverted… a way to highlight bond prices.
When inverted you can see that yields are testing a trend line and may be double topping after March’s large reversal.
If this pattern plays out, bond prices may fall while bond yields begin to rise. Stay tuned!
Note that KimbleCharting is offering a 2 week Free trial to See It Market readers. Just send me an email to services@kimblechartingsolutions.com for details to get set up.
Twitter: @KimbleCharting
Any opinions expressed herein are solely those of the author, and do not in any way represent the views or opinions of any other person or entity.


: Showing Some Signs of Emerging Strength")
