Active management is all about placing bets on companies or sectors that the portfolio management team believes are poised to outperform; and by extension placing smaller or no bets on areas of the market expected to underperform.
These “bets,” relative to the overall market, comprise how a strategy is different to the overall market, typically measured by a market-capitalized index or benchmark.
This results in being – in often-cited terminology – overweight, market weight or underweight a given sector.
Before jumping into the topic of an active management decision to place a bet and being over- or underweight a given sector, it is important to understand the stock market benchmark or index.
Most stock market indices, such as the S&P/TSX Composite (TSX) or the S&P 500 Index (S&P), are simply the result of the number and size of companies trading on an exchange that meet the index-inclusion methodology.
At various times and in certain countries, this can lead to a well-diversified benchmark or a benchmark that is overly skewed towards some sectors and not enough in others.
The TSX has historically been a poorly diversified index – to varying degrees. For instance, in the late 1990s, Nortel lifted the Information Technology sector weight to about 40% of the total index. While everyone may love technology companies, especially recently, having a market weight of 40% in one sector is just not prudent from a risk management perspective.
Conversely, Health Care was about 1% of the TSX a few years ago following a spate of M&A activity in the sector. Having 1% in health care is also not very prudent. And there is no question the TSX has had a very healthy weight in bank stocks for years.
While some sector “bets” are for risk management purposes, some can result in crowded trades if many managers are overweight a given sector; or conversely, uncrowded trades. Chart 1 contrasts the sector weights of Canadian equity funds & ETFs compared to the TSX weights. The fund weights are asset weighted.
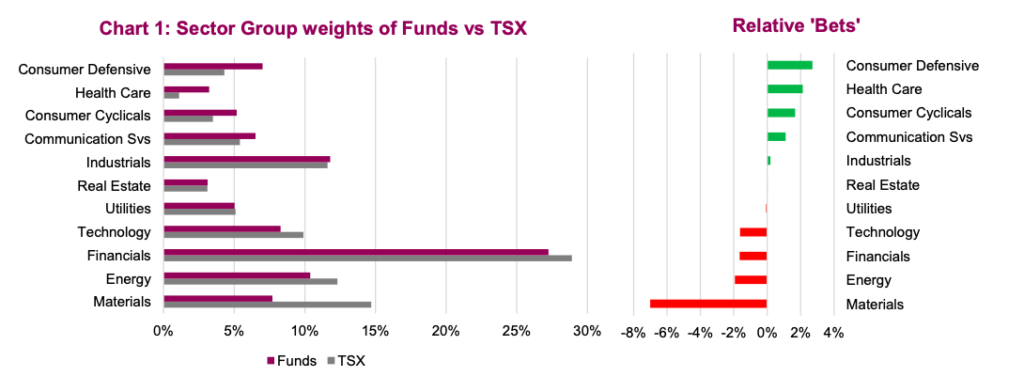
Chart 1 is ranked from biggest overweight, potentially most crowded, to least crowded or biggest underweights. A few aspects are not too surprising. Defensive consumer companies are not plentiful in Canada and managers are likely using some of their limited allocation that can be invested internationally to gain exposure. There are many global brands that are defensive consumer stocks in the U.S. for instance. Health Care likely fits this approach as well.
However, two of the biggest aggregate underweights are in Technology and Materials (that includes gold companies). These are the two best-performing sectors in Canada so far in 2020 which does not bode well for performance relative to the index (for the average, of course).
A year of high divergence will likely leave most underperforming
There are years when nothing really happens and then there are years when a lot happens. 2020 is far from over but it has been an extremely eventful year. This has been reflected in the equity markets with a full deep bear, massive recovery and multiple changes in the types of companies leading in both directions. Chart 2 contrasts the year-to-date performance of the TSX sectors, with the TSX right in the middle.
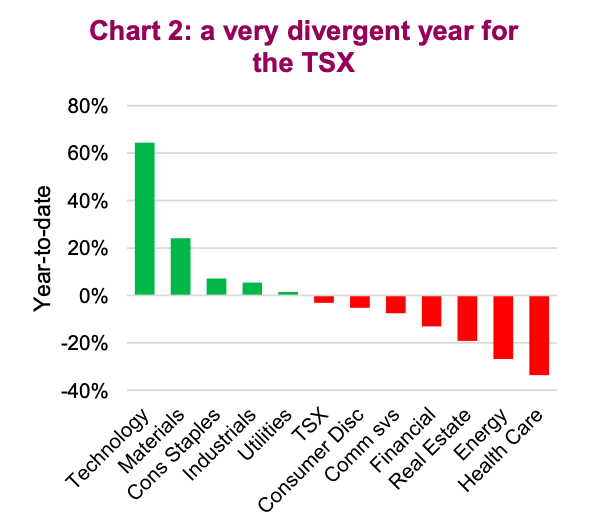
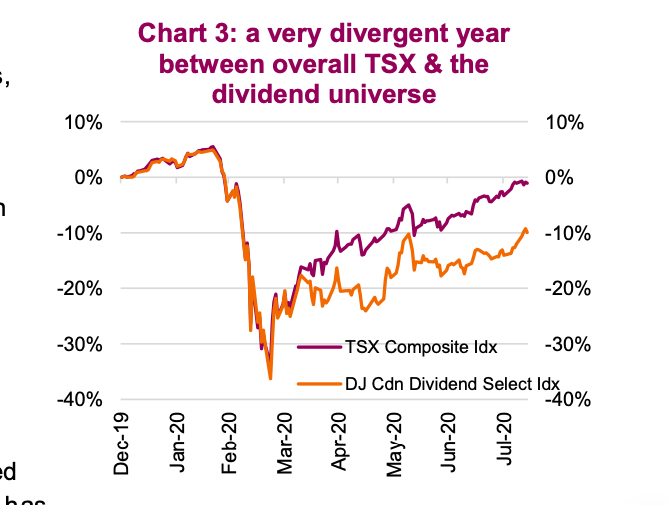
If an active manager did not have a decent exposure (bet) in Technology or Materials, this is likely not shaping up as a good year. You can also see this in the divergence between the dividend-paying companies versus the overall index. There are not many dividend-paying Canadian companies in Technology or Materials. Worse yet, there are many dividend-paying
companies in Financials, Real Estate and Energy, some of the worst-performing sectors.
Chart 3 contrasts the overall TSX Composite versus the DJ Canadian
Dividend Select Index (DS), the latter being a better proxy for dividend focused investors. The DS index is trailing this year by about 10%, an indication that it has too much of what is not working and too little of what is working.
Not surprisingly, the actively managed funds/ETFs in the Canadian Dividend & Income category, are down on average -11.5% in 2020 with none up on the year (based on our search). However, that does not imply all are just following the dividend index. Many are down -15% or worse. Some are better. The fund in this category that our team manages (Purpose Core Equity Income) is down on the year but a less drastic -4% (placing the fund in the top 10% based on year-to-date performance).
Being underweight Financials and having no Real Estate until a couple months ago really helped, as did our Technology exposure, mainly via the U.S. market. Overall though, it has been the healthy gold weight that really provided a boost. The upshot? Dividends are an important characteristic, but diversification remains more important.
All charts are sourced to Bloomberg L.P. and Richardson GMP unless otherwise stated.
Twitter: @ConnectedWealth
Any opinions expressed herein are solely those of the authors, and do not in any way represent the views or opinions of any other person or entity.

")


")