Anyone involved in the business of providing or receiving financial advice is likely keenly aware of KYC – Know Your Client.
This is part of the regulatory framework that is designed to ensure those providing advice have a good understanding of their client’s situation, goals and objectives –clearly a good idea. Better understanding or knowledge of the client is critical in the advice process to ensure the advice is appropriate and fits with the client’s long-term goals.
For those who manage portfolios (and those who own portfolios), we believe in the need for KYP – Know Your Portfolio.
This should entail understanding the following: how a portfolio is constructed; what sectors, factors and risk premia the portfolio has higher or lower exposure to; what kind of market, economy, environment is the portfolio designed to outperform; and which scenarios would it underperform. The portfolio management process and available tools have come a long way over the past few decades.
Remembering back to when some of us entered the industry, portfolios were once constructed on the back of a single research department’s buy and sell recommendations. How inadequate that seems today.
In our research today, we take a brief walk through some of the tools widely available in the industry and explore some deeper analytics that the Connected Wealth team uses in their portfolio management process. We apologize up front – this may get slightly technical and a tad nerdy.
Note: When we say ‘portfolio’, we are referring to any portfolio from an actively managed mutual fund, portfolio of individual equities, passive or active ETFs, etc. For this research report we are focused on a North American equity portfolio that tilts more towards higher dividend- paying companies.
KYP – The Basics
There are many basic portfolio characteristics that are widely avaliable such as geographic allocation, sector weights, holdings, etc. This provides a good baseline for how a portfolio is allocated and can help provide some context as to the exposures.
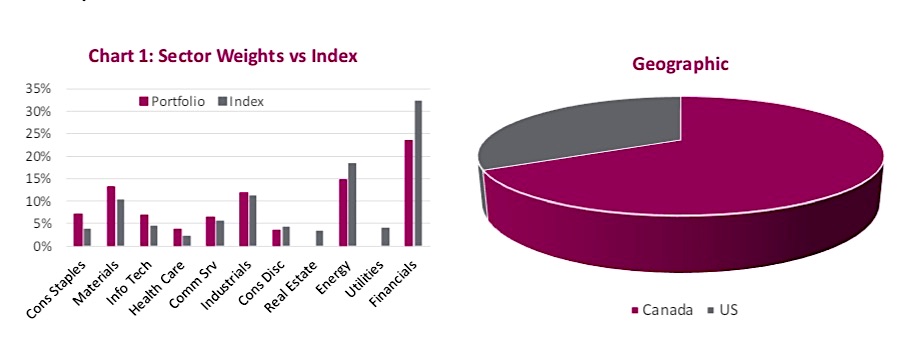
In Chart 1 above, there is a sizeable underweight in financials, energy, real estate and utilities. The biggest overweights are in consumer staples, materials and technology.
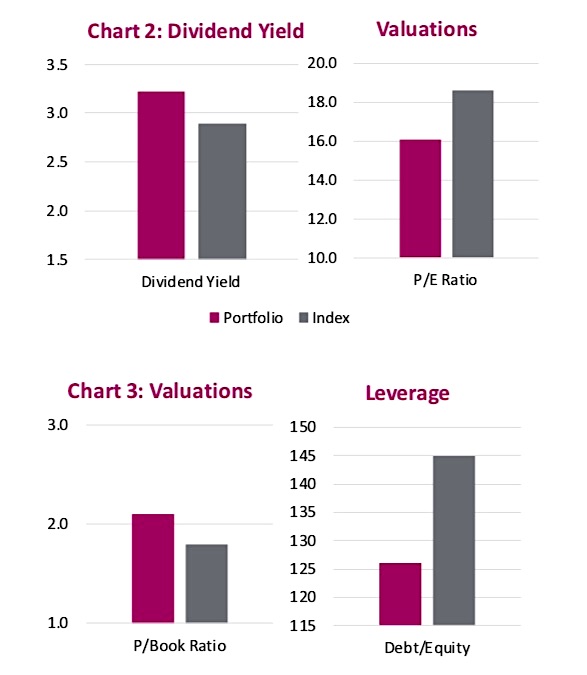
Portfolios also have fundamental characteristics. These can include the yield of the portfolio relative to the benchmark/index, market cap, valuation metrics, financial leverage, etc. These details often will reveal the style of the portfolio, as to whether it is more value or growth oriented, large-cap or small-cap focused, etc.
Charts 2 and 3 include dividend yield, price-to-earnings (PE) ratio, price-to-book (P/Book) and debt to equity ratios for the Portfolio versus the Canadian equity index. The portfolio has a slightly higher yield. Valuations are mixed with the PE ratio lower but the P/Book higher. Meanwhile, financial leverage is materially lower than the overall index.
All these characteristics help paint a more detailed picture of a portfolio, well beyond just relative sector weights. But it does not necessarily paint a picture of what to expect within different market environments. Who cares if valuations are lower unless it implies something about future performance.
KYP – Scenarios
So how can we expect a portfolio to perform (or underperform) should we experience an oil crisis, a strong rise in equity markets, an emerging market debt crisis or a major earthquake? While specific scenarios are unlikely to repeat exactly, this type of scenario analysis can help a manager or investor understand what type of general environments they should do well in and what types they won’t.
These are usually based on a factor model and incorporate the individual
holdings within the portfolio. For example, a big drop in oil prices is negative for both, but more so for the TSX. Conversely, if oil prices rise, the TSX should win. There isn’t a right answer to any of these scenarios; it is more about having a deeper understanding of what kind of environment your portfolio should outperform versus underperform.
And deciding if this fits with your expectations of where the markets are going in the coming quarters or years.
KYP – Factor Decomposition
If you looked at a portfolio that was overweight energy, one may conclude the portfolio is positioned to benefit from rising oil prices which often accompany rising global economic growth. However, if that portfolio was actually overweight oil refiners and pipelines, the opposite may occur. Pipelines for instance are more sensitive to changes in bond yields and the credit market than changes in oil prices. Improving global economic activity may lift oil prices and bond yields, hurting the share price of pipelines.
It’s difficult to “win” if you don’t know where you placed your bets.
A multi- factor decomposition of a portfolio can uncover sensitivities to various macro factors. Think of it as trying to explain individual share performance based on multiple different ‘betas’. Traditional beta is a company’s price movements relative to the index. Other factors, or betas, could include the U.S. equity market, emerging markets, oil, bond yields, credit spreads, etc.
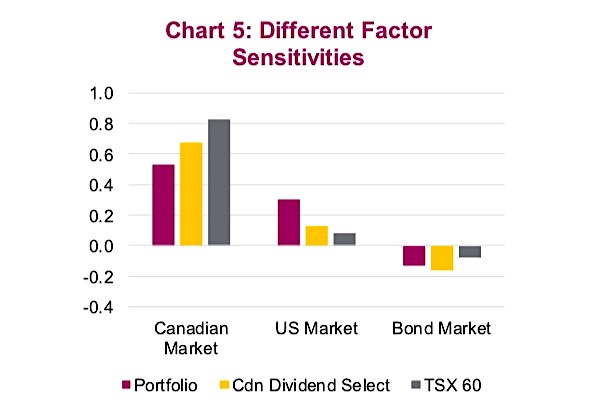
In the next chart, we only include the following factors: Canadian and U.S. equity markets along with bonds. If the Canadian equity market rises, TSX 60 should do best, followed by Canadian Dividend Select than the Portfolio. If the U.S. equity market rises, the Portfolio is best exposed.
Again, there is no right answer–it is more about understanding portfolio exposure and positioning appropriately. For instance, if you wanted to reduce your portfolio’s exposure to rising yields, you could add more companies that have a negative factor contribution to the bond market (like insurance companies).
Conclusion
The tools and capabilities are out there to gain a deeper understanding of your portfolio, an index and a fund. These capabilities go well beyond relative sector weights. While scenario analysis or factor decomposition shouldn’t drive an investment process, it should be a part of it.
Source: all charts are sourced to Bloomberg & Richardson GMP
Twitter: @ConnectedWealth
Any opinions expressed herein are solely those of the authors, and do not in any way represent the views or opinions of any other person or entity.

: Showing Some Signs of Emerging Strength")

