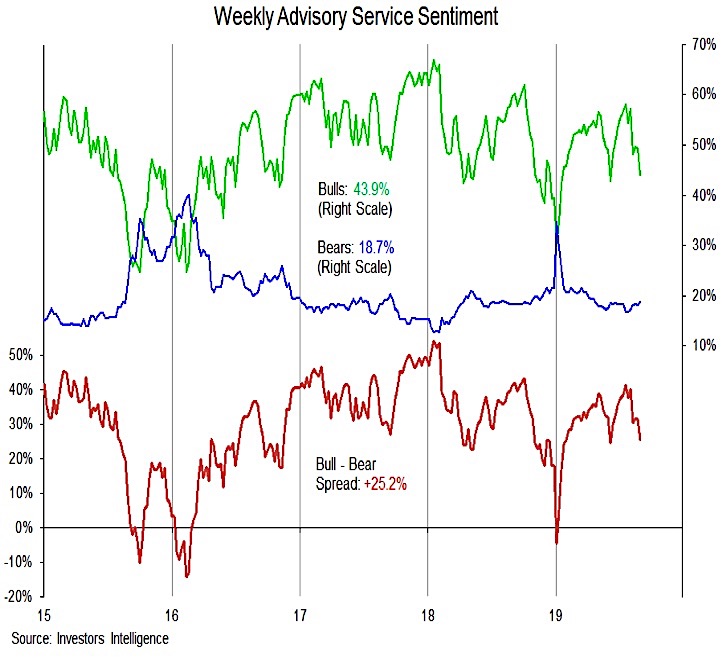
Another survey showing still elevated levels of optimism is the Investors Intelligence survey of advisory service sentiment. Here, bulls remain above 40% and bears are in the teens. While both are off of their recent extremes, it is hard to suggest that the optimism that quickly returned as stocks rallied earlier this year has been replaced with fear.
Options data also provide a mixed sentiment message – demand for protective puts has sent put/call ratios surging (typically evidence that fear is building), but the VIX is moving lower (evidence that complacency is on the rise).
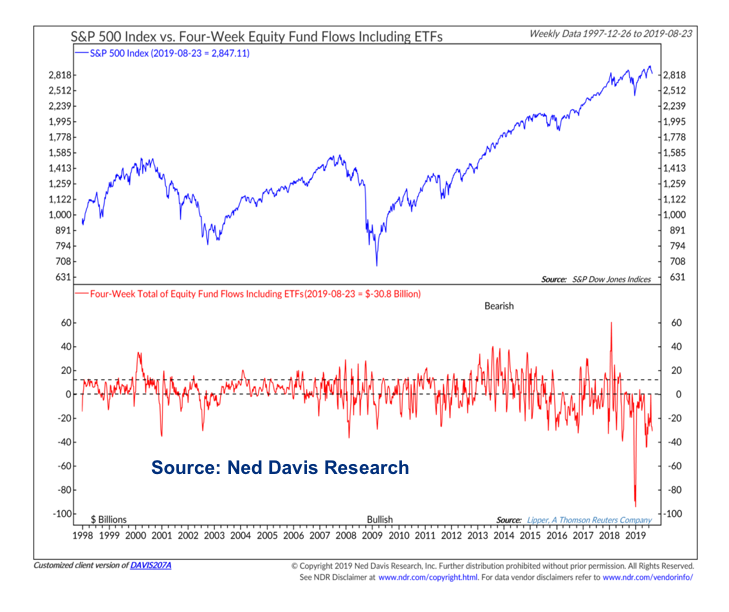
Fund flow data is often used by those looking for evidence that fear is widespread and that equities are unloved. While the weekly flow data is measured in billions, the overall level of assets measures in the trillions – flows are literally pennies on the dollar of assets.
For a look at overall household asset allocation form the perspective of mutual fund and ETF assets, see last week’s Market Commentary (page 3).
This flow data may be useful in indicating when near-term sentiment extremes are reached (as it did in January 2018 and in December 2019).
Going forward if the entrenched optimism present in the monthly data is being unwound, the December 2019 data is likely to like less of an outlier.
Twitter: @WillieDelwiche
Any opinions expressed herein are solely those of the author, and do not in any way represent the views or opinions of any other person or entity.


: Showing Some Signs of Emerging Strength")
