We would need a supercomputer to track the number of articles and tweets over the last few months regarding “excessive” or “near record” levels of investor complacency and overconfidence. If you have experience with investor sentiment, you know it is not particularly useful until it reaches extremes.
Therefore, it is prudent for investors and traders to ask:
Is current investor sentiment close to extreme levels?
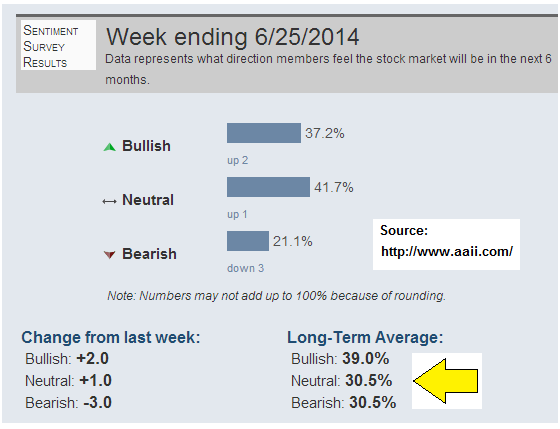
AAII Sentiment Survey
One of the longest running and most widely followed gauge of investor sentiment is the American Association of Individual Investors (AAII) Sentiment Survey. The image below is a screen capture from their website, showing the results of their latest survey. We added the yellow arrow which shows the long-term average of bullish investor sentiment. The long-term average is 39%. Is the current reading wildly optimistic or excessively bullish? No, not even close; the current percentage of bullish responses is below average. Yes, we currently have below average bullish sentiment, which seems to contradict the endless tweets about “near record investor optimism and complacency”.
How About A Broader Look At Sentiment?
A fair question is:
“But, what about the VIX and other measures of sentiment?”
If you ran a business based on market sentiment, it is fair to say you can be classified as a sentiment expert. Jason Goepfert does just that – he offers a service, known as SentimenTrader. The service is based on facts, rather than opinions. SentimenTrader publishes short-term and intermediate-term composite sentiment readings and risk levels. The Short-Term Extreme Model (STEM) is a model consisting of several sentiment measures including:
- TICK
- TRIN
- Put/Call ratios
- VIX
- Proprietary sentiment measures
Is the current, unbiased, and numerically based short-term sentiment risk level off the charts? No, the model currently sits at an “average risk” level, which aligns with the not-concerning AAII survey. How about SentimenTrader’s intermediate-term model? It returns a “slightly above average risk” reading. Note the use of the term average, rather than extreme.
How About The Low VIX?
We have covered this topic in the past, but since the chatter of “low VIX warnings” is ongoing it remains relevant. 4 key points to consider:
- The VIX Fear Index is arguably the most over-analyzed tool on Wall Street relative to its real world predictive powers of where stocks are headed.
- The common argument is when the VIX spikes, it is indicative of rising fear, and thus stocks typically drop when the VIX rises.
- The VIX measures “expected volatility”, which is quite a bit different than fear.
- Can stocks go up when the VIX rises significantly from low levels? You can decide for yourself after reviewing a historical example.
Sounding The Low VIX Sirens For Stocks
If you follow the markets regularly, you have probably run across similar passages to the one shown below from a May 28, 2014 MarketWatch article:
As the VIX continues to sink closer to its historic low of 9.39, many commentators are now discussing the VIX as a “complacency index.” As the VIX falls, it signals increasing levels of investor complacency. Because economist Hyman Minsky taught us that periods of high volatility follow periods of low volatility, many investors are beginning to worry that a “Minsky moment” could be lurking around the next corner that would send volatility higher, increase the risk premium for holding stocks and cause prices to sink.
Low VIX Means Trouble For Stocks, Right?
The VIX is currently close to a historic low. If that means historic complacency, then logic would tell us that when the VIX rises from very low levels, it must mean rising fear and bad times ahead for stocks…right? That logic often holds in the markets, meaning the VIX can be and is a useful tool for stock investors. However, the strength of a stock market indicator lies in its consistency. Can stocks rise as the VIX rises from low levels? History not only says “yes”, but it does so emphatically. The chart below shows a period beginning in late 1995 when the VIX started to rise from low levels. The VIX surged from 10.36 in 1995 all the way to 38.20 in late 1997, which is a major spike in the VIX. How did stocks perform over the same period? The S&P 500 gained 47%…yes, that is not a typo…stocks gained 47% during a period when the VIX more than tripled.
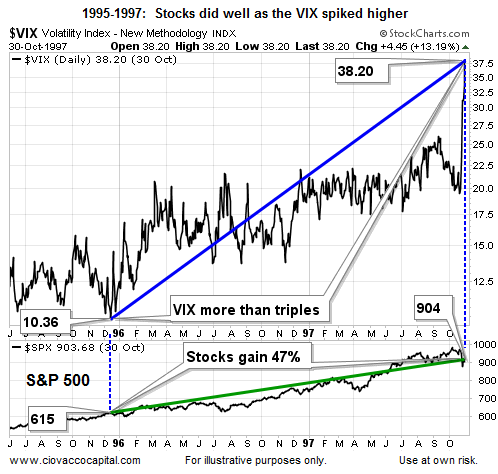
For those scoring at home, the 47% move in stocks began when the VIX showed “a high level of investor complacency” with a reading of 10.36. What was the recent 2014 low in the VIX? 10.61, which is quite similar to 10.36.
The VIX Is About Volatility, Not Fear
There is nothing wrong with having the VIX in your stock market toolkit. However, the VIX needs to be used in the proper context to be more helpful to longer-term stock investors. From Yahoo Finance:
Today the VIX sits below 11.50 and stocks are slightly higher despite weak earnings and a widely expected, but still ugly, negative print in first quarter GDP. Rather than interpreting the market action as complacency traders are generally just accepting that the VIX is lower because the market is open for business. The thing is, the VIX never measured “fear.” It measures expected volatility. If 11.5 seems like a low print that’s only because you aren’t putting it in the context of single-digit trailing volatility. The VIX is low for a reason and that reason is that stocks simply aren’t going down in large enough gaps to justify paying much for insurance.
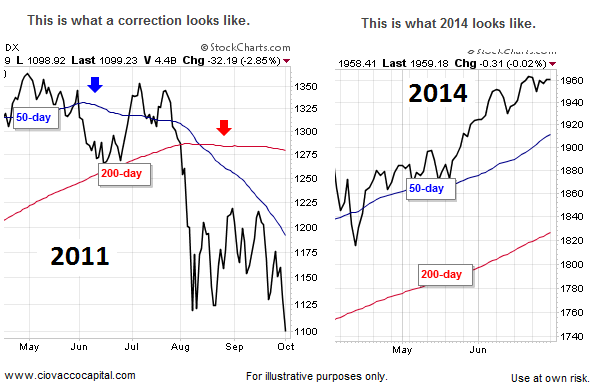
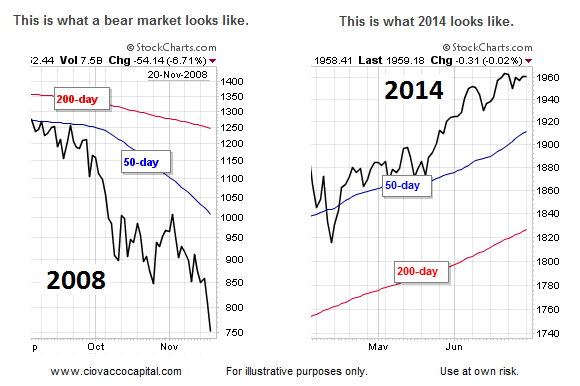
Stocks Cannot Correct Until This Happens
Have stocks corrected after the VIX hit low levels? Yes, we can find numerous historical cases where a rising VIX occurred during a weak period for equities. Regardless of what the VIX does, we know one thing with 100% certainty; the stock market cannot morph into a multiple-month correction or a bear market until the chart of the S&P 500 begins to break down. How vulnerable does the broader stock market look right now? Answer – not very vulnerable relative to the look of a correction or bear market.
Moral Of The Story
Having worked on Wall Street for over 20 years, we can confidently state that you can always find a bearish narrative that sounds logical. The same can be said for a bullish narrative. Rather than reaching conclusions based on one chart (the VIX) or a handful of charts, it is best to look at the weight of all the evidence. We do that with our market model, but there are numerous ways to effectively monitor and manage big picture investment risk. Charles Rotblut, CFA, vice president at AAII, summed it up this way:
Never rely on a single indicator when forecasting market direction. Rather, consider a variety of factors—including prevailing valuations, economic data, Federal Reserve policy, government policies and other prevailing macro trends—and allow for a large margin of error in your forecast. As the saying attributed to John Maynard Keynes goes, the market can stay irrational longer than you can stay solvent.
Paying Attention vs. Forecasting/Anticipating
Rather than stressing about a low VIX or investor sentiment, it is best to pay attention with an open mind. The concepts of paying attention versus forecasting are illustrated via the comparisons below – which added more value? you can decide:
2008: Paying Attention And Adjusting
2008: Investing Based On Expert Forecasts
Thanks for reading.
No position in any of the mentioned securities at the time of publication. Any opinions expressed herein are solely those of the author, and do not in any way represent the views or opinions of any other person or entity.


