Weekly Stock Market Takeaways:
– Near-term investor sentiment getting frothy.
– Consumers turn cautious on outlook for stocks.
– When adjusted for asset levels, cash on sidelines looks meager.
Improving stock market breadth is supporting a more bullish view of the overall weight of the evidence.
With stock markets at home (see S&P 500 Index – INDEXSP: .INX) and around the world moving to new highs, investors have generally turned more bullish. Lacking evidence that optimism is widespread and excessive, we continue to see investor sentiment as neutral overall.
The latest round of investor sentiment surveys does show increased optimism among investors:
The Investors Intelligence survey of advisory services shows 57% bulls, up from 47% just a month ago and the highest level since August. Bulls on this survey peaked at 58% in July, and were above 60% in October 2018.
The NAAIM data shows that active investment managers significantly increased equity exposure over the course of October and the Exposure index (92%) is now at a level similar to what was seen prior to stock market weakness in May and August.
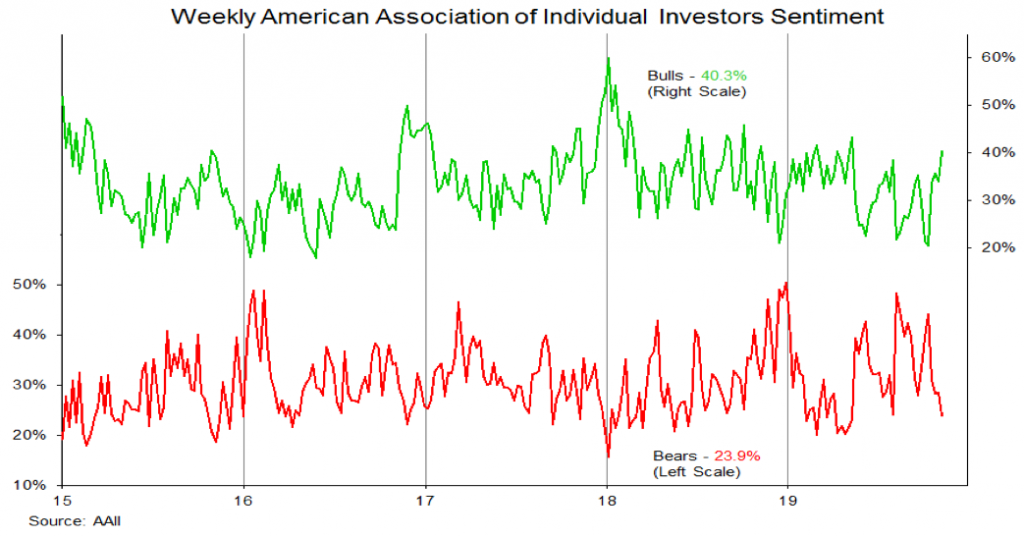
AAII bulls are twice as high as a month ago and at their highest level since May (bears are at their lowest level since May). It might not be full-throated yet, but individual investors are at least humming the tune “I’m a believer . . .”
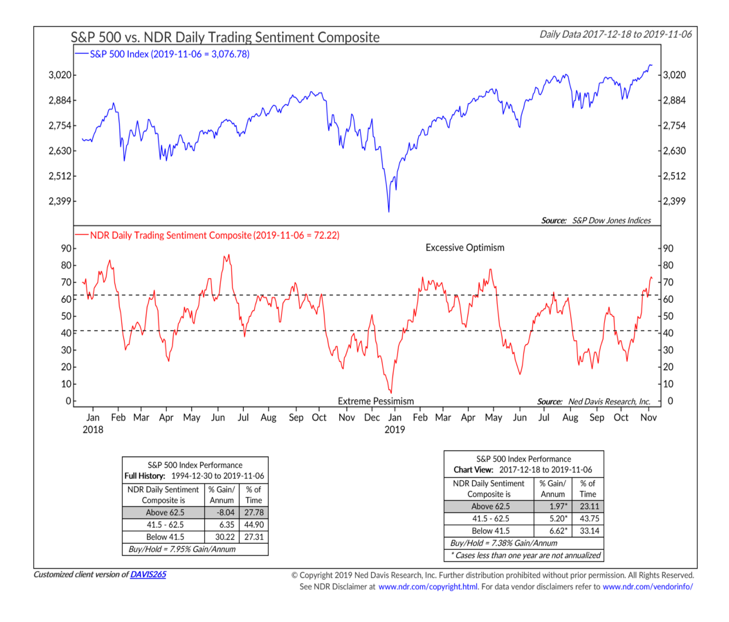
When these and other sentiment surveys are aggregated and added to even more volatile options-related data, a picture of short-term excessive optimism emerges. This is reflected in the recent surge in the NDR Daily Trading Sentiment Composite. Stocks have historically struggled in the face of excessive optimism. The more recent experience, however, has been mixed. Over the last couple of years, neither contrarian buy nor sell signals have packed their historical potency. Some of this may be due to the intense focus on investor sentiment in the current cycle, but may also be due conflicting signals across various time frames.
While short-term indicators are showing more optimism, there is evidence of continued skepticism form more intermediate-term perspective. Embedded in the monthly the University of Michigan Consumer Sentiment and Conference Board Consumer Confidence surveys are questions about expectations for stocks. In both of these, consumers are reporting a more bearish view on stocks.
The U of Michigan survey shows that from July to October those expecting a rise in stock prices declined from 64% to 57%, which is similar to the levels seen in December/January. The Conference Board data shows that since July those expecting stocks to rise have fallen from 41% to 32% and those expecting stocks to decline rose from 22% to 32%. This is hardly evidence of excessive (or even elevated) optimism.
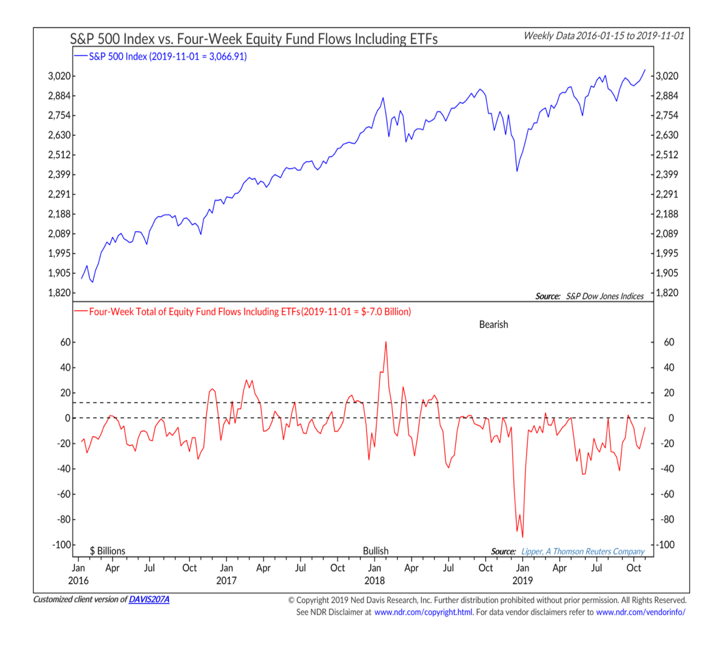
Even with the weekly ebbs and flows in the sentiment surveys, equity funds have seen a persistent pace of outflows over the past year. Stocks have actually tended to do well in this environment. The pace of outflows has slowed in recent weeks. This was seen prior to stock market weakness in May, August and early October.
Given the cautious view expressed in the Consumer Sentiment and Consumer Confidence surveys, we may need to see more than just a slowing in outflows to suggest that sentiment is getting excessively optimistic. Daily flow data do suggest equities are seeing inflows, but we are still waiting for confirmation in the weekly data.
Despite the weekly outflows from equity funds, household exposure to equities remains historically elevated. Media reports this week of a hoard of cash on the sidelines waiting to be deployed may be more noise than news. Aggregate fund data suggests that when adjusted for overall equity and bond exposure, cash levels are at historically low levels. Nominal cash levels are close to their 2009 peak, but a decade ago that represented 43% of total household assets and it now represents just 17%. Elevated household exposure to equities has historically been followed by sub-par equity market returns.
Twitter: @WillieDelwiche
Any opinions expressed herein are solely those of the author, and do not in any way represent the views or opinions of any other person or entity.


