Despite increasing levels of news and binary analyst thoughts (noise), stocks appear to be stuck in consolidation mode.
Highlights from our October Investing Strategy Outlook & Beyond:
- Bond Yields Moving Higher
- October Surprise Potential Keeps Focus On Election
- Investor Optimism Has Been Slow To Unwind
- Breadth Backdrop Bullish, But Not Yet Breaking Higher
Amid all the noise that can (and to often does) emerge on a day-to-day basis, it can be easy to overlook the reality that the last three monthly closing values for the S&P 500 had a range of 6 just points (2174 in July, 2171 in August, 2168 in September). The rally that carried the S&P 500 to a new all-time high (and a better than 3% gain for the quarter) came in the first couple of weeks of the first month of the third quarter. Since mid-July, the S&P 500 has gone nowhere, but has gotten there quickly. Our review of the weight of the evidence suggests it may not yet be time to look for this pattern to change.
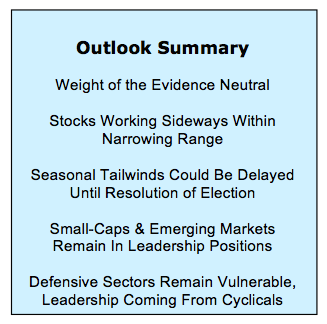
Beneath the surface, however, conditions are not nearly so static. Bond yields have moved off of their lows. Emerging markets are breaking out to new highs relative to developed markets. Small-caps continue to trend higher relative to large-caps. Sector-level trends have shown a continued rotation in a leadership away from so-called “low volatility” sectors and toward more cyclical areas of the stock market. We have witnessed improved relative strength from economically sensistive areas like the Transports and Broker/Dealers. Overall there is little evidence to dissuade us from the view that the fourth quarter may ultimately belong to the bulls. Equally lacking, however, is evidence that the imbalances (excessive optimism and a narrowing in near-term measures of breadth) that stymied stocks for much of the third quarter have been relieved. We are, though, now less than one month away from the completion of the 2016 presidential election and are looking forward to whatever modicum of certainty it may provide.
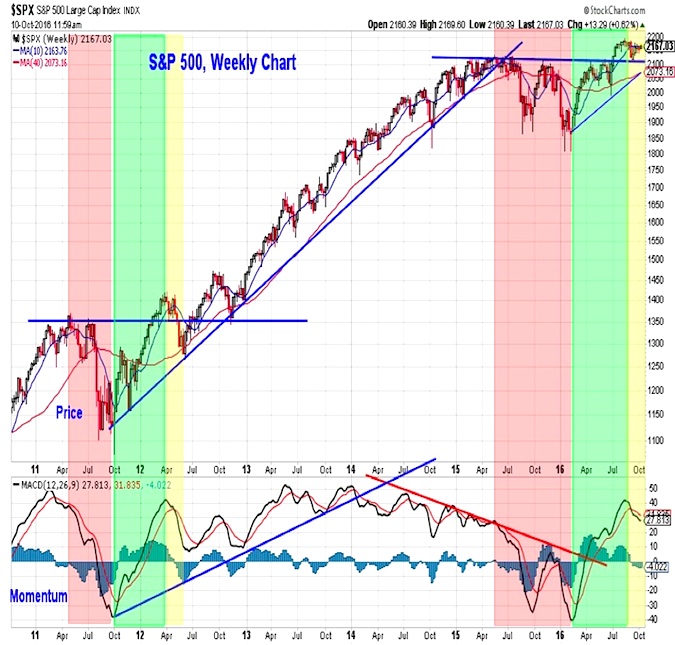
S&P 500 Index
The day-to-day noise can at times overwhelm the bigger picture. The weekly chart for the S&P 500 provides important context. After a nearly 20% rally off of the February lows (which was accompanied by a significant improvement in longer-term breadth trends), stocks have struggled to make headway for nearly three months. This consolidation/correction is part of healthy pattern. Based on the experience coming out of the previous cyclical bear market, we could see a break below the previous highs and a test of the 40-week average (2100, and 2065, respectively). At this point, any correction that does emerge is expected to be short-lived and the emerging cyclical up-trend could re-assert itself as we move further into the fourth quarter. We are watching the weight of the evidence to confirm that this is happening.
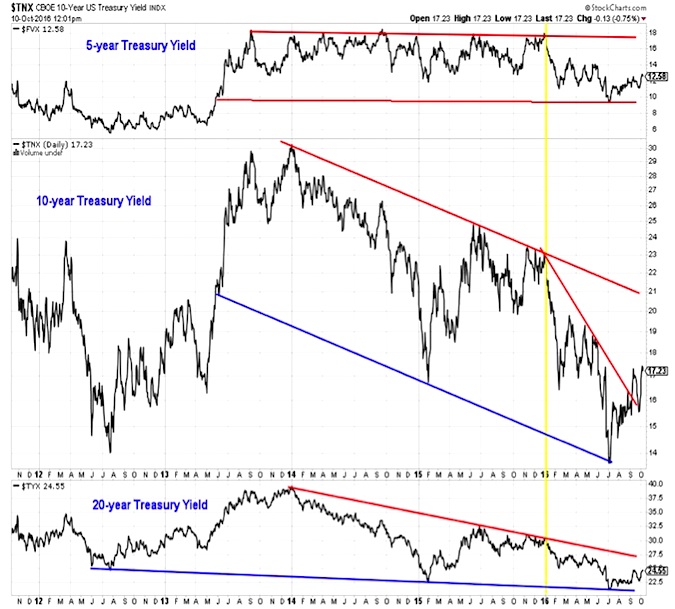
U.S. Treasury Yields
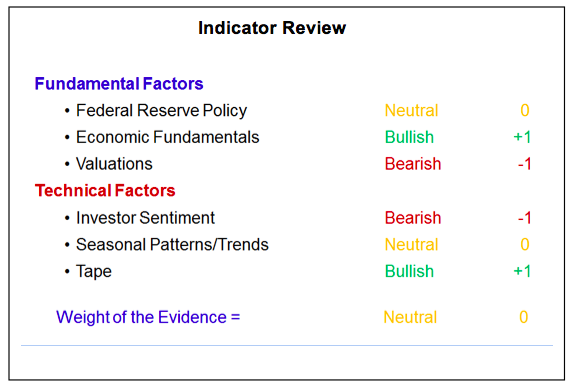
Fed policy is neutral. The Fed passed on raising rates at the September FOMC meeting. The three dissenting votes (all whom wanted to raise rates) and the post-meeting press conference by Janet Yellen have left many looking for a rate hike when the Fed meets in December. While there is an FOMC meeting in November, it comes just days before the presidential election and the likelihood of the Fed raising rates at that meeting is virtually nil. Even without a rate hike, bond yields have already started to move higher. The benchmark 10-year T-Note yield has broken above the down-trend that emerged over the course of this year, and German 10-year yields have actually moved back into positive territory.
Market Indicators & Valuations
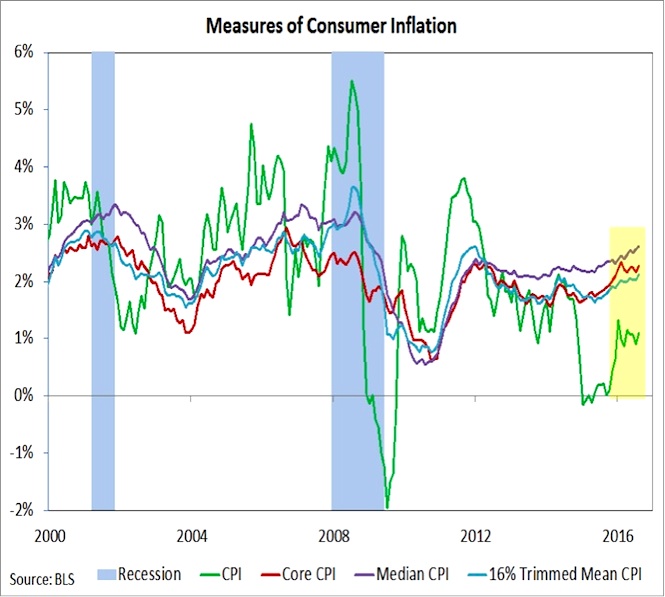
Behind the rise in yields has been talk of a shift in focus from monetary easing to fiscal easing. The specifics of any fiscal stimulus that may be seen in the United States are highly dependent on the outcome of the November elections. Already, however, we have seen evidence that inflation is moving higher. While runaway inflation remains unlikely, there does seem to be sufficient upward pressure on prices to merit moving interest rates toward a more neutral long-term level. In fact, all four of the various computations of consumer inflation seen here are higher than when the Fed raised rates in December of 2015. The yearly change in the median CPI (as developed and calculated by the Cleveland Fed) is at its highest level since 2009.
Economic Fundamentals are Bullish. Stepping back from the month-to-month changes in volatile data, we have been encouraged in 2016 by the sustained up-trend in wage growth. This reflects increased demand for workers and has been accompanied by an increased willingness of workers to voluntarily quit one job and look for better opportunities elsewhere. Two data series confirm this continued strength in the labor market. First, weekly initial jobless claims (probably the most reliable leading economic indicator) remain at or near multi-decade lows. Secondly, real median household incomes surged more than 5% in 2015 (the largest increase in decades) to a level last seen in 2007. This is evidence that the benefits of the economic recovery are beginning to be more broadly enjoyed.
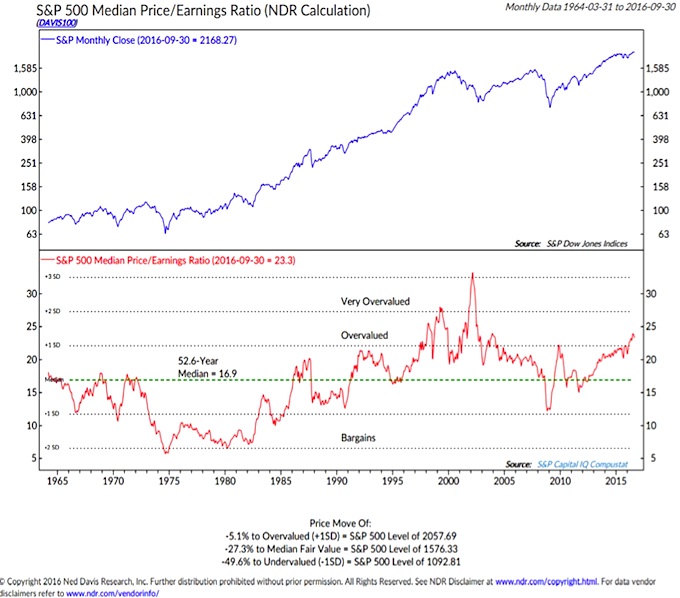
Valuations remain Bearish. It is hard to find a valuation measure that does not suggest stocks are expensive at current levels. The debate seems mostly to be about whether stocks are merely overvalued (as the Median P/E Ratio shown here indicates) or very overvalued as valuation measures based on normalized earnings suggest. We remain especially wary of the crowded low-volatility/defensive areas of the market, where valuations are at or near record levels. The still modest uptick in bond yields has had a particularly pronounced effect on these areas. Valuations reflect risk in the market and elevated valuations are associated with depressed forward returns. The good news is that with corporate leverage high, it might not take much of an uptick in sales growth to spur a rebound in earnings (which would help begin to relieve these excesses).
read more on the next page…


