The chart of the median P/E ratio for the S&P 500 shows that stocks have moved into overvalued territory.
There are multiple ways to measure valuation, but this is our preferred measure, as it removes the effects of both earnings estimates and earnings outliers. While valuations are poor timing tools in the short-run, they represent a useful assessment of risks over the intermediate to longer run. With better economic growth fueling a recovery in earnings, valuations could start to improve even without a meaningful pullback in prices.
Investor Sentiment & Stock Trends
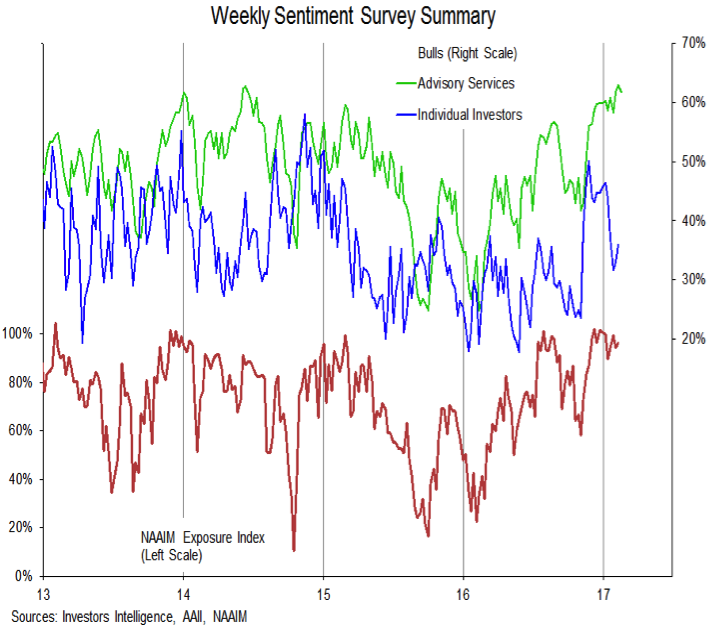
Sentiment has turned bearish on evidence that excessive optimism is widespread. Bulls on the Advisory Services survey have surged to their highest level in over a decade and the NAAIM exposure index shows that active investment managers are almost fully committed to stocks. On the other hand, bulls on the AAII survey of individual investors have retreated after surging in late 2016 and are actually now outnumber by bears on that survey. While we continue to see investor sentiment overall as near-term headwind for stocks, the heightened policy uncertainty in Washington DC could be helping offset the optimism seen in the sentiment surveys.
Seasonal Patterns/Trends are bullish. The cycle composite for 2017 suggests investors could look for strength over the first half of the year, followed by a perhaps meaningful pullback in the second half.
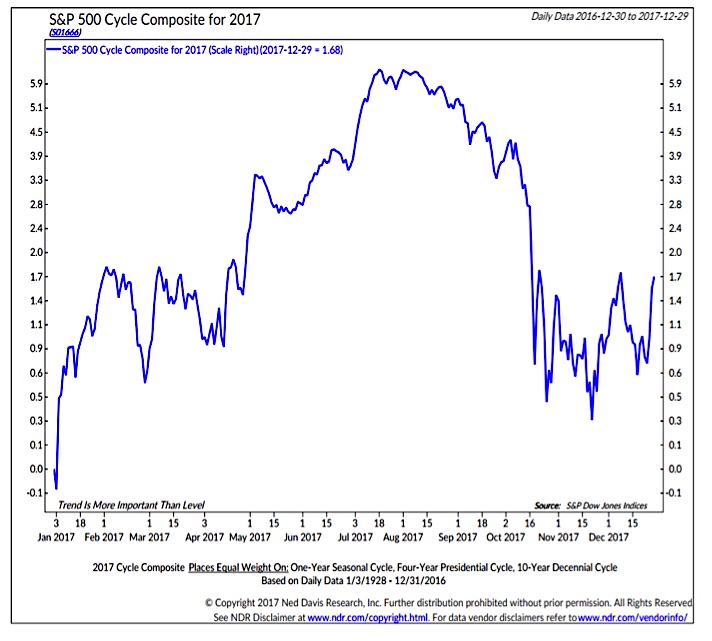
Some of this follows typical policy patterns that emerge with a new administration. As early optimism yields to unmet expectations, stocks can weaken. As we move through the first half of 2017, continued economic strength and progress on regulatory and tax reform could help sustain a more bullish seasonal trend. Further, an uptick in the volatility that has been lack in recent months could help relieve some of overbought pressures that have emerged. Modest consolidation now could help provide a stronger foundation from which to rally later.
Broad market trends are bullish. As mentioned at the outset, the new highs being seen on the S&P 500 have not been in isolation. In fact, for the first time in more than 25 years, the S&P 500, NASDAQ Composite and Dow Industrials have all made new highs in five consecutive trading sessions. Outside of the Dow Utilities and small-cap value indexes, virtually all broad-based domestic indexes have been making new highs.
Further encouragement comes from the strong trends at the industry group level and the ability of the Dow Transports to confirm the highs on the Dow Industrials.
Overall improving economic and stock market momentum could help sustain the strength that emerged in 2016 and helps keep the path of least resistance higher.
![]()
From portfolio perspective, we continue keep elevated levels of cash (keep dry powder) but match this against equity exposure that is benefitting from both rising bond yields and improving economic fundamentals. Sector leadership is coming from Industrials, Technology and Financials. Global leadership remains with the United States (especially for U.S. based investors) and Emerging Markets.
Thanks for reading.
Twitter: @WillieDelwiche
Any opinions expressed herein are solely those of the author, and do not in any way represent the views or opinions of any other person or entity.

: Showing Some Signs of Emerging Strength")

