While the AAII survey has more bears than bulls, neither is at a historical extreme. Likewise, while the bull-bear spread on the Investors Intelligence survey has been cut in half from where it was in January, the survey overall still shows more bulls than bears (by about a two-to-one margin). Taken in total and balanced against recent readings (which is what the NDR Crowd Sentiment Poll does), sentiment has moved from extreme optimism to extreme pessimism and is now bullish for stocks.
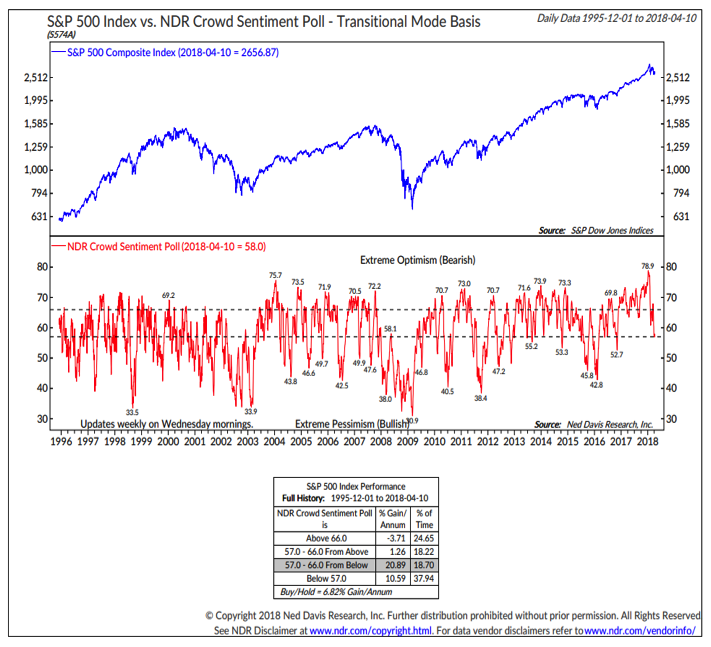
This is echoed by the move seen on the NDR Daily Trading Sentiment Composite, which also shows excessive pessimism.
Our caution with respect to sentiment is that longer-term measures that take into account cash levels, liquidity and equity exposure show little evidence of concern on the part of investors. This data tends to be slower to react given its frequency (for example the chart here on household equity exposure is released on a quarterly basis). So while we are not seeing a meaningful build in cash on the sidelines or other evidence of increased liquidity, the rise in near-term pessimism as expressed by investors could be sufficient to stem some selling and provide a tailwind of stocks rally off of their recent lows.
Seasonal Patterns and Trends have turned bearish. With the recent announcement from Speaker Ryan that he will not be running for re-election this fall, the outcome of the mid-term congressional races could be more in doubt than ever, especially if it leads to another round of Republican incumbents announcing they are retiring. Even without that announcement, mid-term elections were likely to weigh on stocks as the market has to sort out likely election outcomes and weigh a possible change in control of Congress. This could add to the volatility that has already been seen in 2018. The good news is that even though stocks tend to weaken ahead of mid-term elections (especially in non-recession years), they tend to bottom ahead of the election and then rally strongly over the ensuing year.
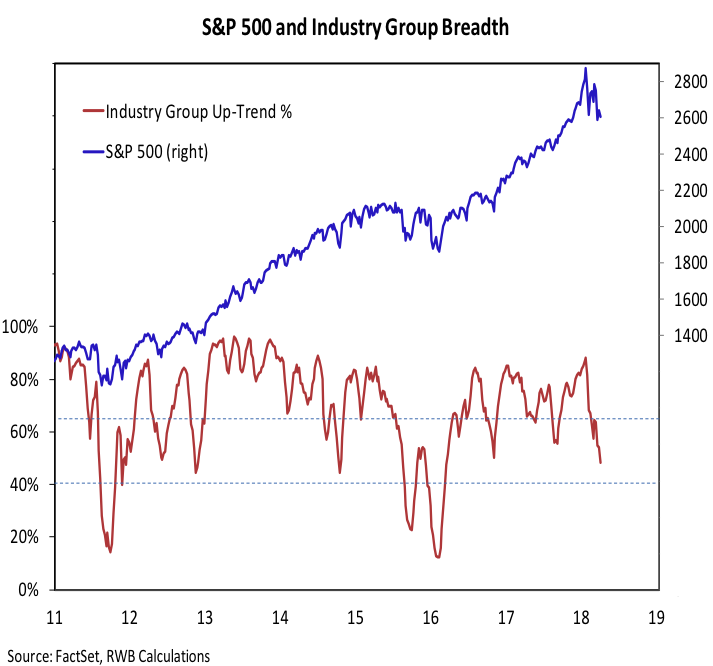
Breadth is still neutral but is deteriorating. The percentage of industry groups in up-trends has moved to a new cycle low, slipping below 50%. Rather than seeing evidence of positive broad market divergences as the popular averages have re-tested their February lows, we have seen further broad deterioration. This does not preclude a bounce, but it does suggest near-term upside could be limited. The market itself will likely provide evidence that the current period of weakness/consolidation has come to an end when rallies are able to be strong enough and persistent enough to produce upside breadth thrusts. As a starting point, we continue to look for at least two trading days where upside volume outpaces downside volume by better than 9-to-1. Until then, stocks could be in for continued consolidation.
Thanks for reading.
Twitter: @WillieDelwiche
Any opinions expressed herein are solely those of the author, and do not in any way represent the views or opinions of any other person or entity.


