It’s been an uneasy consolidation for stocks since the retest of the February lows in late March/early April.
If the bulls want to win the battle here (and get the bull market back on track) they will need to see several indicators improve, including breadth and momentum. In this outlook, we look at the technicals, fundamentals, sentiment, and market breadth.
Highlights:
- Fed Continues on Path of Normalization
- Economy Remains on Firm Footing
- Elevated Expectations for Q1 Earnings
- Stock Valuations Still Elevated
- Breadth Trends Deteriorating
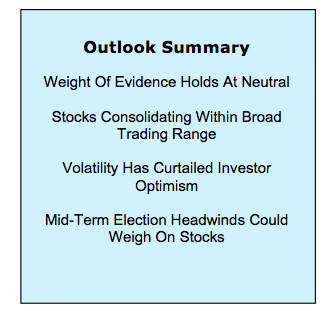
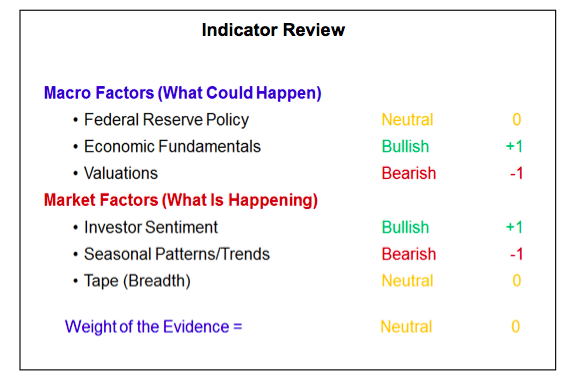
Stock market volatility remains high and while there have been some shifts at the indicator level, the overall weight of the evidence remains neutral. With the mid-term election season starting to heat up, Seasonal Patterns/Trends have dropped from Neutral to Bearish. Offsetting this has been evidence that investor optimism, at least on a short- to intermediate-term basis, has been sufficiently unwound that Sentiment is now Bullish for stocks. We remain somewhat concerned with longer-term sentiment indicators, particularly the apparent lack of cash and liquidity available to investors. Other factors remain largely unchanged. Despite some potential for deterioration, Breadth and Fed Policy are still neutral. Economic Fundamentals remain bullish while Valuations remain bearish. The overall weight of the evidence is consistent with further consolidation for stocks, likely within a broad trading range.
Of particular focus, moving into the second quarter is the ability of companies to deliver on elevated earnings expectations. The consensus expectation is for earnings to rise between 15-20% in the first quarter. Recent economic data has struggled to match expectations but earnings estimates have remained high. As we work through our review of the weight of the evidence, we will spend some time looking at the recent pattern of earnings expectations and what might need to be seen to have stocks be able to celebrate. The bottom line is that a high bar has been set and a failure to match elevated expectations could fuel more volatility.
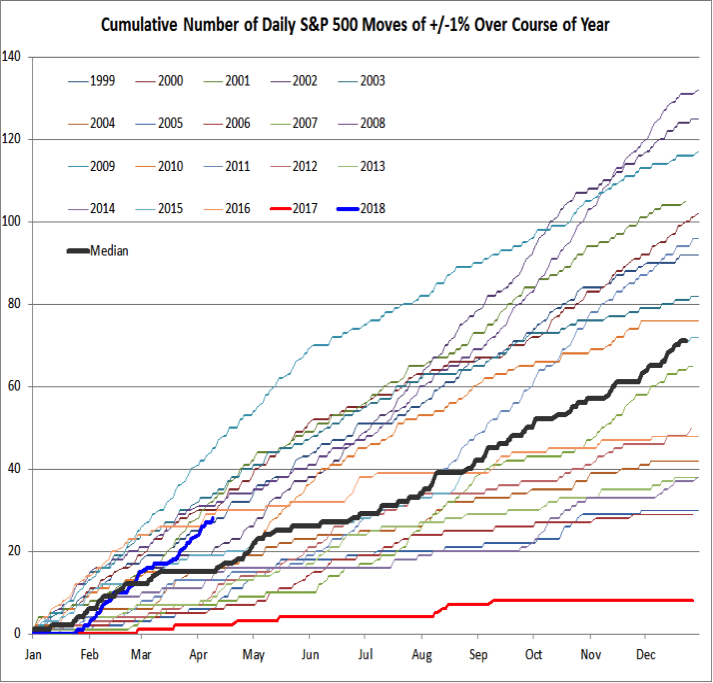
The historically sedate rally of 2017 continues to recede in the rear-view mirror. After seeing just eight daily price moves of 1% or more in 2017, the S&P 500 has now experienced 28 in 2018. All the more remarkable is that the first three weeks of the year fit the pattern of 2017 more than the experience of the past 20 years. As of this writing, the S&P 500 has experienced 28 moves of 1% or more over the past 51 trading days (or over the past ten weeks, we have averaged a 1% move every other trading day). The S&P 500 has already experienced as many 2% daily moves in 2018 as it did 1% moves in all of 2017.
While 2018 is now above the median experience of the past 20 years, it is not the outlier. By this point in 2009, the S&P 500 had seen 45 moves of 1% or more. There is little evidence that this up-tick in volatility is likely to meaningfully ebb anytime soon.
Federal Reserve Policy is still neutral. At its March meeting, the FOMC raised the fed funds rate by another 25 basis points and indicated it currently expects to raise rates two more times in 2018. At this point, rate hikes represent a normalization of interest rates and move toward neutral rather than a meaningful tightening of monetary policy. In the near term, a move back toward 3.0% on the 10-year T-Note could weigh on equities. This interest rate normalization is occurring at the same time that global central banks are poised to slow down considerable the pace at which their balance sheets are expanding. This could turn Fed Policy into a headwind for stocks later this year.
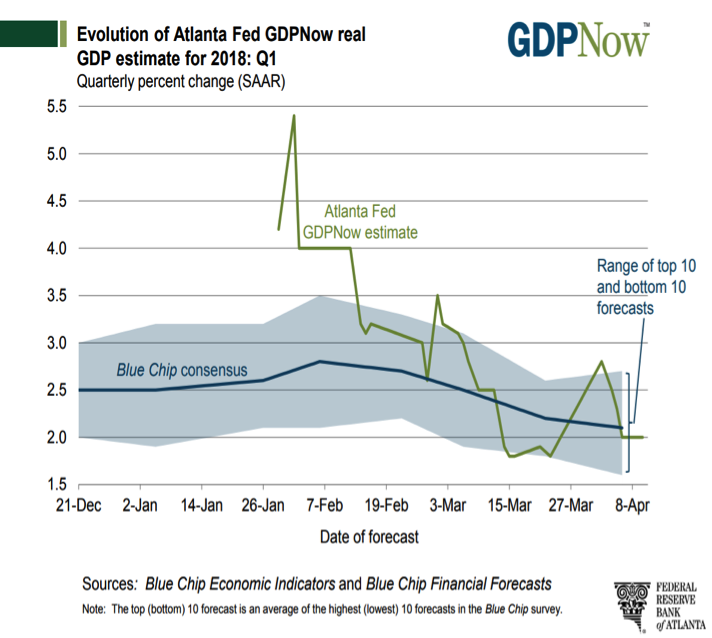
Economic Fundamentals remain bullish. A look at the recent behavior of the economic surprise indexes or the recent path of the Atlanta Fed’s GDPNow estimate of growth for the first quarter might obscure the positive economic trends being seen beyond the headlines. Near-term economic estimates got overly optimistic after failing to capture the economic strength seen in 2017 and the economic surprise indexes are experiencing some routine mean reversion. Likewise, while the GDPNow estimate for the first quarter has dropped from its early readings above 5.0%, the currently expected 2.0% growth in the quarter (which matches the overall consensus) would actually represent an improvement over the 1.2% growth seen in the first quarter of 2017 and would mark the seventh consecutive quarterly increase in year-over-year GDP growth. The economy is accelerating and there is little evidence of meaningfully rising recession risk.
While expectations for economic growth are being reset, a similar trend has not emerged for earnings. Earnings expectations surged earlier this year in the wake of the passage of the tax cuts and as the economy was still providing upside surprises. This sets an exceedingly high bar for the upcoming earnings season. As was discussed in a recent Macro Update (Equity Allocations and Earnings Expectations Are Headwinds For Stocks) stocks have historically struggled when expected median earnings growth has exceeded 14%. Additionally in each of the past six years, earnings estimates have drifted lower over the course of the year. If that pattern holds again in 2018, stocks could be poised for a string of disappointments.
It is not a forgone conclusion that earnings will disappoint in the first quarter or that expectations for the year will drift lower, but a high bar has been set. Over the past 20 years, stocks have struggled when the pace of earnings surprises has ebbed. Stocks could face an important test as the first-quarter earnings season starts to heat up.
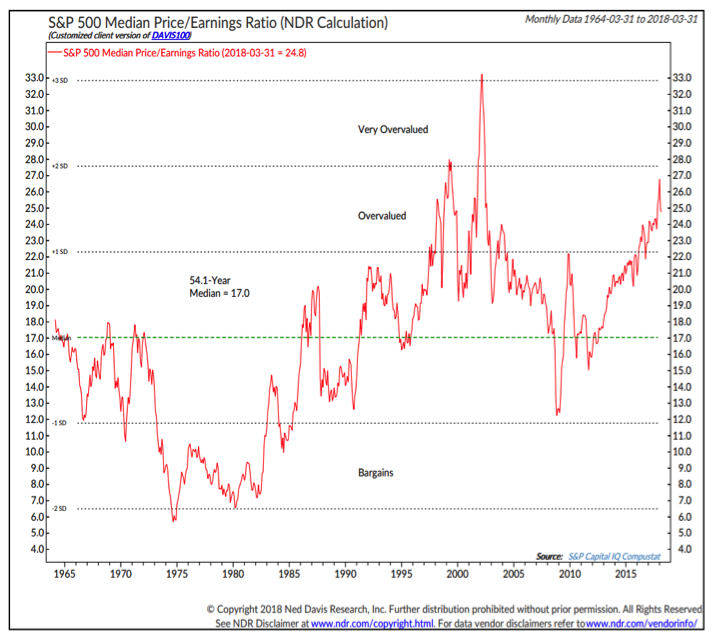
Valuations remain bearish. Delivering on elevated earnings expectations is especially important right now because stocks have already priced-in improving fundamentals. That is the message of the various P/E ratios that we track. While off of its recent high, the median P/E ratio for the S&P 500 (based on trailing earnings) shows that stocks are still overvalued and priced for perfection. Between the rise in earnings estimates and the recent pullback in stocks, valuation measures that are based on forward earnings have shown more meaningful improvement. However, the recent and historical tendency for earnings estimates to be overly optimistic makes these valuation measures less reliable than those dependent on earnings (or sales) that have already been recorded.
Investor Sentiment has turned bullish. The stock market volatility seen so far in 2018 has rattled bullish investors and led to more near-term stock market pessimism. Indicators have a tendency to not always (or ever) line up neatly and that is currently the case with sentiment.
continue reading on the next page…


