Even Warren Buffet Needs Trends
To make significant gains over longer periods of time (weeks, months, years), any investment position must be in an uptrend. The key word is must.
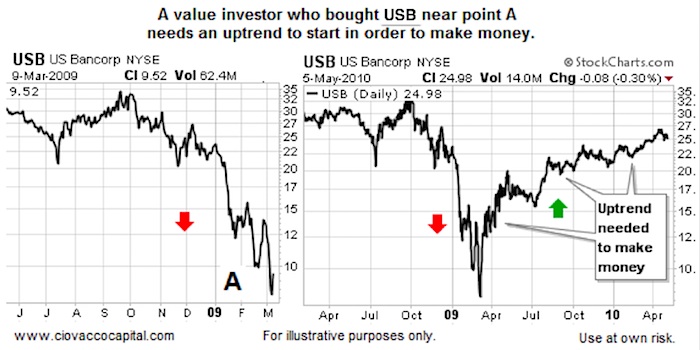
If Warren Buffet purchases company XYZ because he feels it is undervalued, company XYZ will eventually have to resume an uptrend for Mr. Buffet to make money.
If Warren Buffet needs his positions to trend in a bullish manner, it probably makes sense for us to understand how to identify a trend change.
Stock Market Trends: US Bancorp (USB) Stock Chart
Not Many Options To Consider
Stocks, bonds, gold, currencies, or any ETF can do one of three things:
- Go up (uptrend)
- Go sideways (consolidate, trade within a range)
- Go down (downtrend)
The easiest way to make money is to own positions that are going up. Range trading and shorting are different animals beyond the scope of this article.
Requiring Trends To Be Established
One of the best ways to be successful in the markets is to develop a disciplined rules-based system that helps you minimize mistakes. One way to minimize mistakes is to require all your long holdings to be in established uptrends before you buy them. This approach can assist both day traders and longer-term investors. A day trader may require trends to be established on one-minute charts or sixty-minute charts. An investor may require established uptrends to be in place on daily, weekly, and/or monthly charts.
How To Indentify An Uptrend
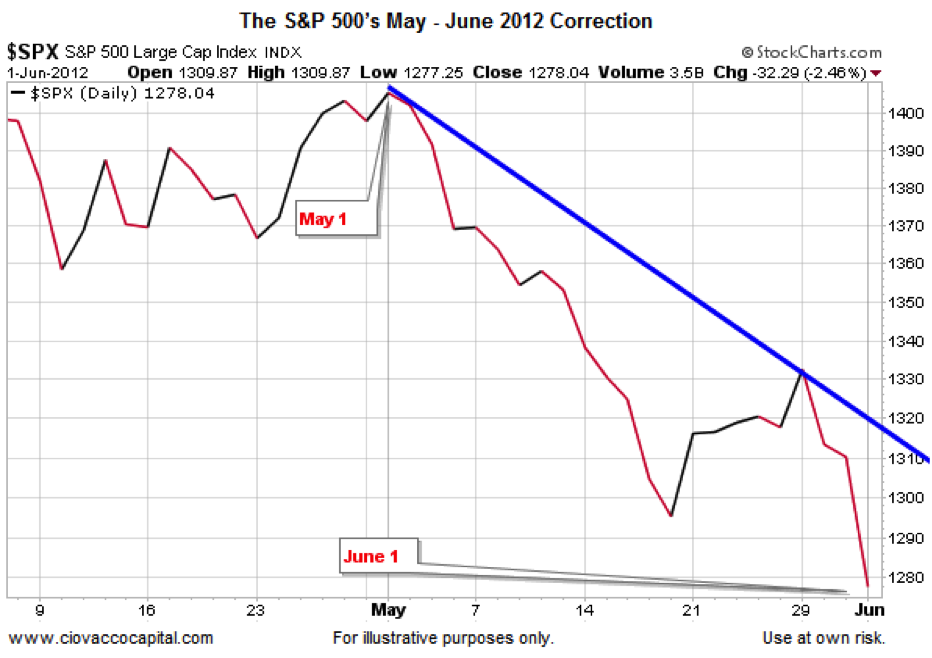
If trends are required to make money and requiring all your long positions to be in established uptrends can minimize mistakes, we better know how to identify a new uptrend. Let’s use an example that is still relatively fresh in our minds. As you probably recall, the S&P 500 began to fall in a fairly rapid manner between May 1 and June 1, 2012. The blue downward-sloping trendline shows an established downtrend.
Stock Market Trends – S&P 500 (SPX) May-June 2012 Correction Chart
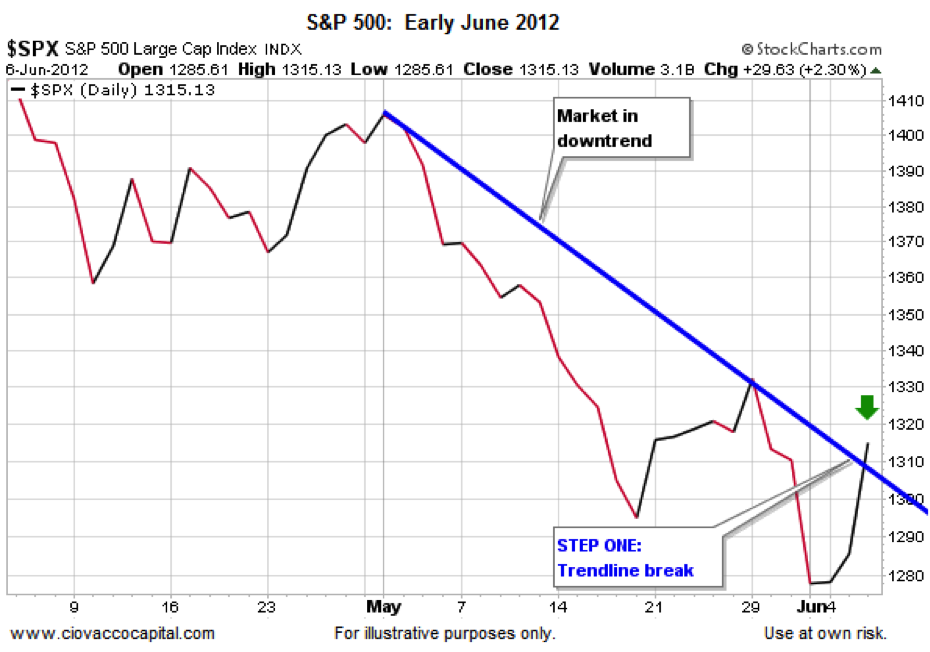
Step One – Break of a Bearish Trendline
As you might guess, if a new uptrend is going to begin, the market will eventually have to break above the bearish trendline. Step one of three needed for a new uptrend is just that – a break of a trendline.
Stock Market Trends – S&P 500 (SPX) June 2012 Trendline Break Chart
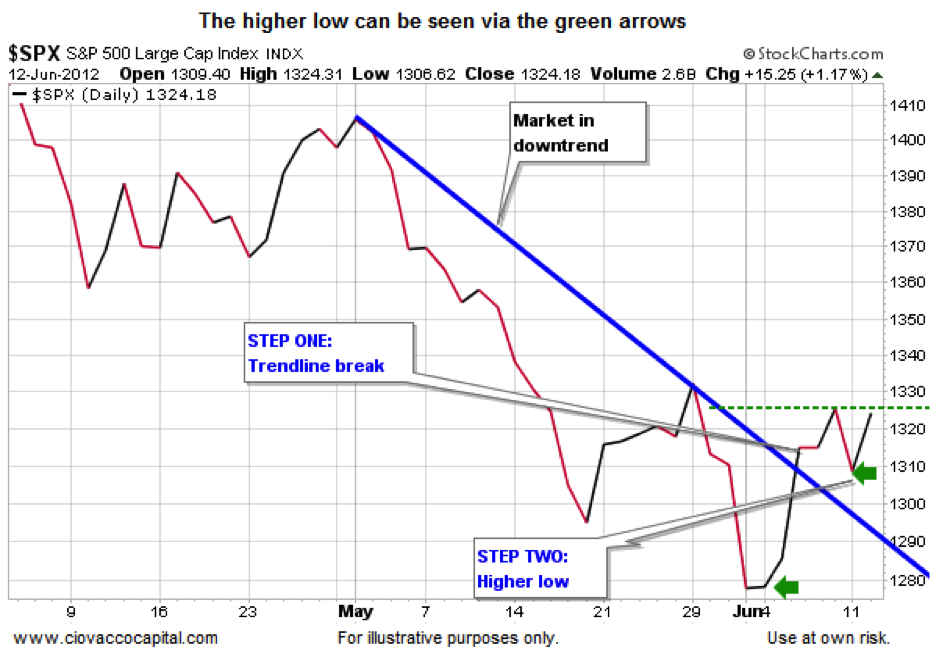
Step Two – Have To Break Pattern Of Lower Lows
Since a bearish downtrend consists of lower highs and lower lows, a market that is establishing a new uptrend must break the pattern of lower lows. Therefore, step two of three in the process of forming a new uptrend requires a higher low relative to the previous low.
Stock Market Trends – S&P 500 (SPX) June 2012 Higher Low Chart
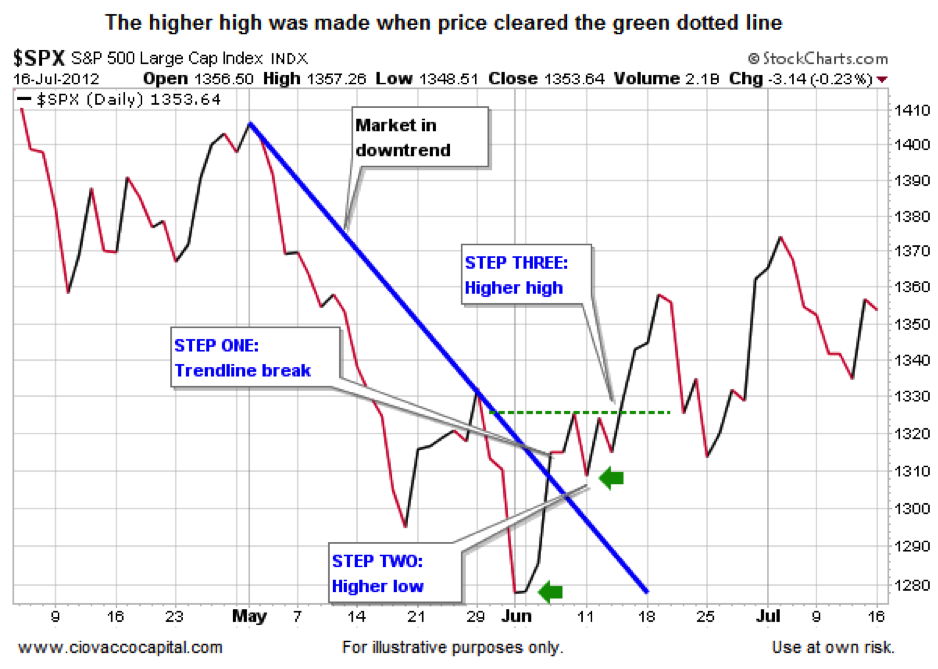
Step Three – A Higher High
Since an uptrend is defined by a series of higher highs and higher lows, it is logical to assume at some point we need to see a higher high, which is exactly what step three requires.
Stock Market Trends – S&P 500 (SPX) June-July 2012 Higher High Chart
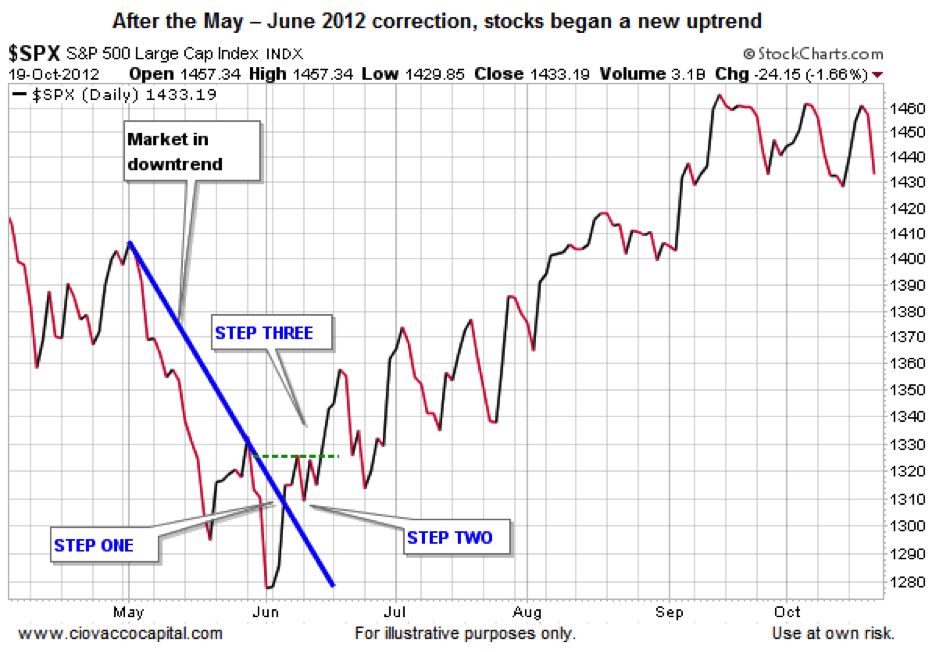
After Step Three, Bullish Odds Improve
What happened after step three of three was completed in June 2012? The S&P 500 tacked on an additional 140 points over the next three months.
Stock Market Trends – S&P 500 (SPX) July-October 2012 Follow Through Uptrend Chart
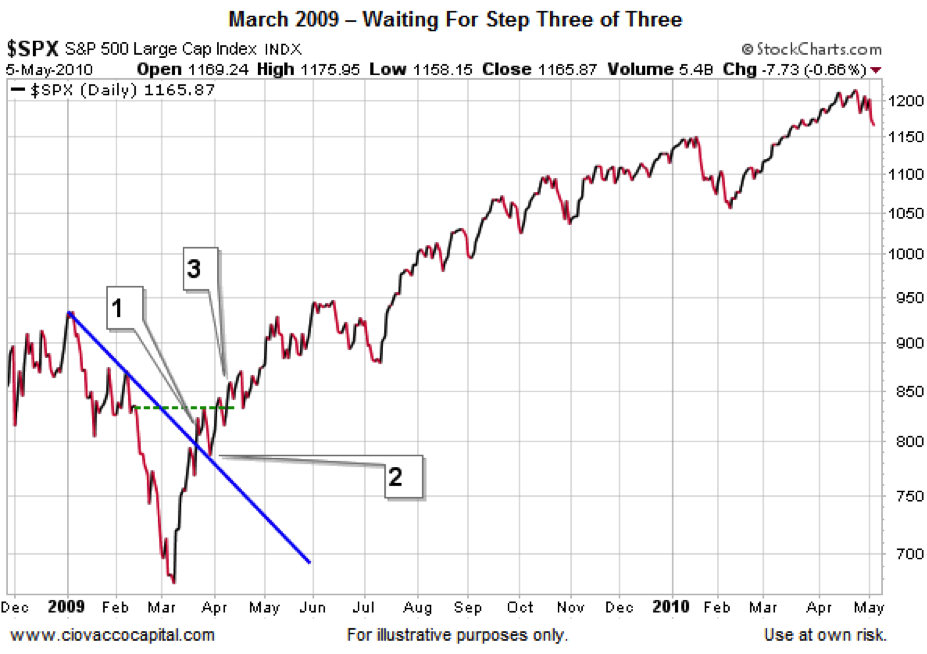
Don’t Catch A Falling Knife
If you did not wait for an uptrend to be re-established in February 2009, you may have bought the S&P 500 near 875 or just before it plunged to the March 9 intraday low of 666. Once the three steps required for a trend change were completed in late March 2009, there was still plenty of time to profit.
Stock Market Trends – S&P 500 (SPX) 2009 Bottom Chart
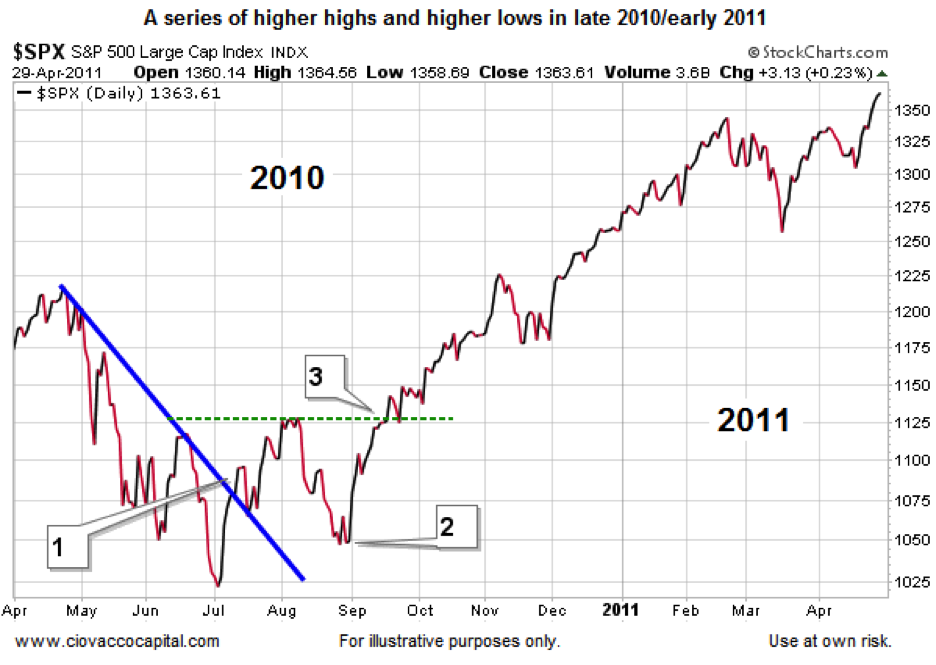
2010: Being Patient Paid Dividends
Just as we noted even Warren Buffet needs an uptrend to start in order to be successful, a buyer of the S&P 500 who waited for step three to be completed after the 2010 “flash crash” was rewarded handsomely.
Stock Market Trends – S&P 500 (SPX) 2010-2011 Trend Change Chart
Whipsaws Say No Approach Is Perfect
As we noted earlier, one of the best ways to be successful in the markets is to develop a disciplined rules based system that helps you minimize mistakes. Notice the previous sentence uses the term “minimize” rather than “eliminate”. Any experienced trader or money manager will tell you there is no perfect system, indicator, method, or model. However, they will also tell you there are numerous ways to reduce the odds of making mistakes and increase the odds of being successful. Waiting for uptrends to become established is one way to become a better trader or investor. Trends may seem simple, but simple is helpful and simple works. Trends are a major component of our market model. Learn more about our market model here.
Editor’s note: We welcom Chris as a new contributor to See It Market. His wealth of market experience and technical/fundamental depth will definitely be a benefit for our readers. Learn more about Ciovacco Capital.
Twitter: @CiovaccoCapital @seeitmarket
Any opinions expressed herein are solely those of the author, and do not in any way represent the views or opinions of any other person or entity.


