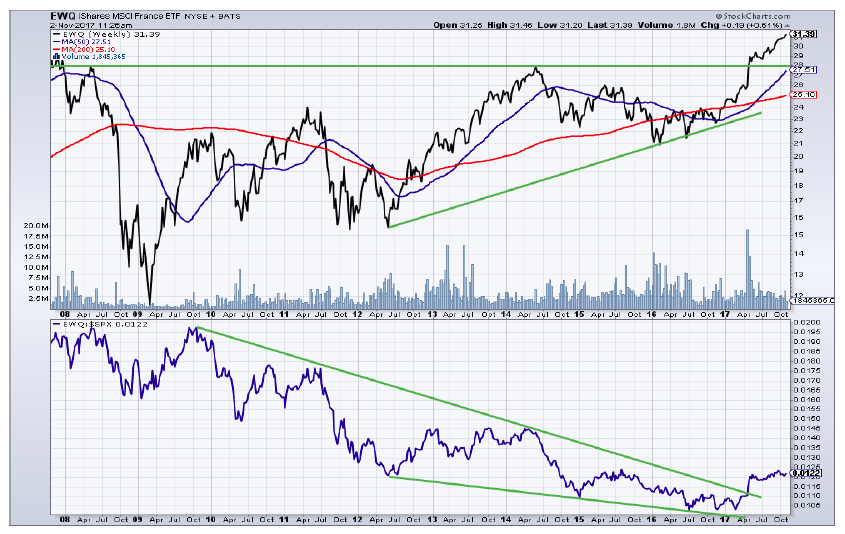
ISHARES MSCI FRANCE ETF (EWQ)
Nice break from ascending triangle earlier this year, which was accompanied by heavy volume. RS break vs. “500” confirms price break. Well diversified ETF.
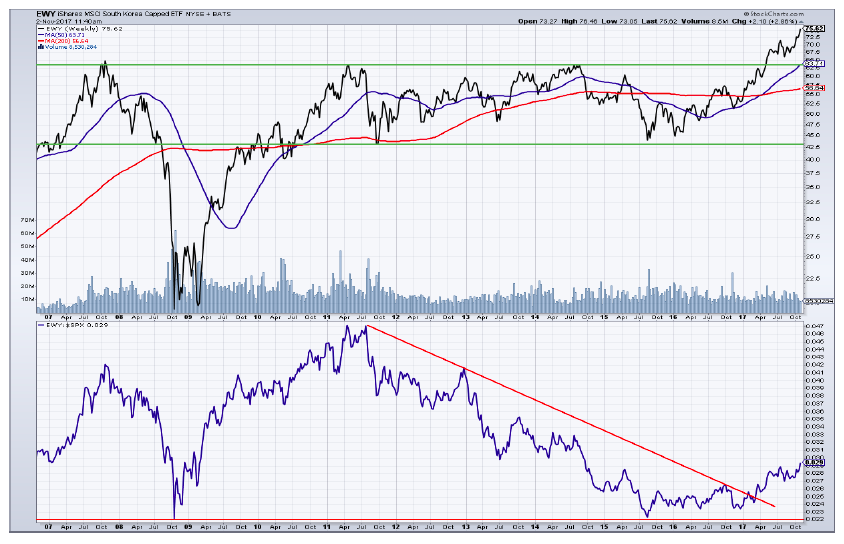
ISHARES MSCI SOUTH KOREA ETF (EWY)
Bullish breakout from massive multi-year base with RS breakout. Love this action considering its northern neighbor. Warning: Samsung is 25% of ETF.
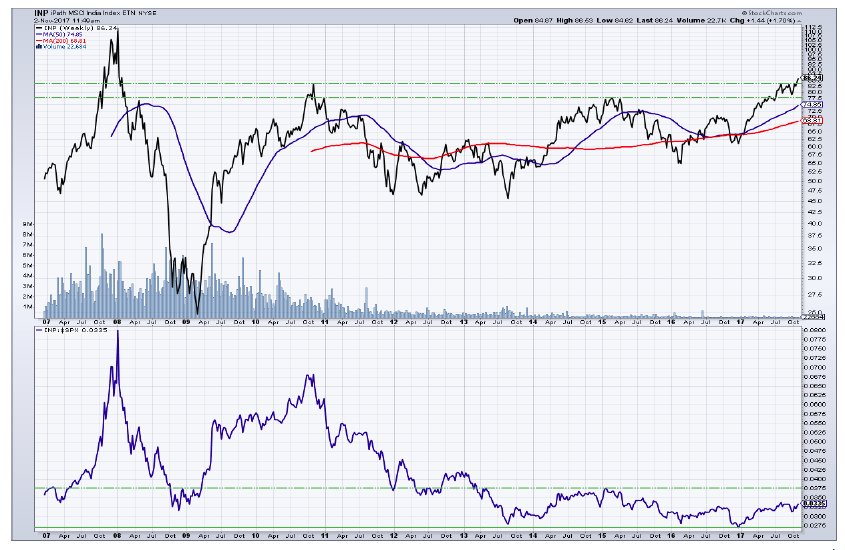
ISHARES MSCI INDIA ETF (INP)
Just breaking out from massive consolidation. But RS vs. the S&P 500 needs to breakout to confirm. Still basing. One to watch! Well diversified.
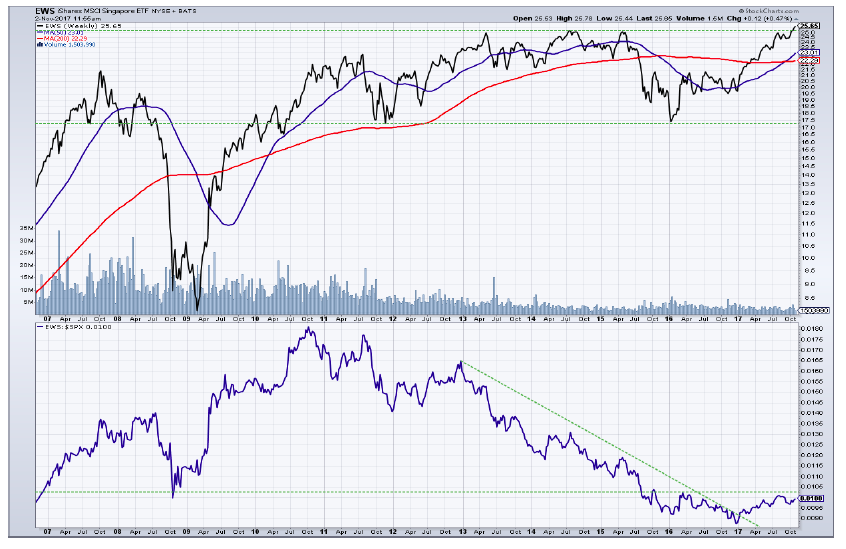
ISHARES MSCI SINGAPORE ETF (EWS)
Just breaking out from massive price base. RS still trending sideways vs. the “500.” One to watch. Warning: Four stocks make up 46% of ETF.
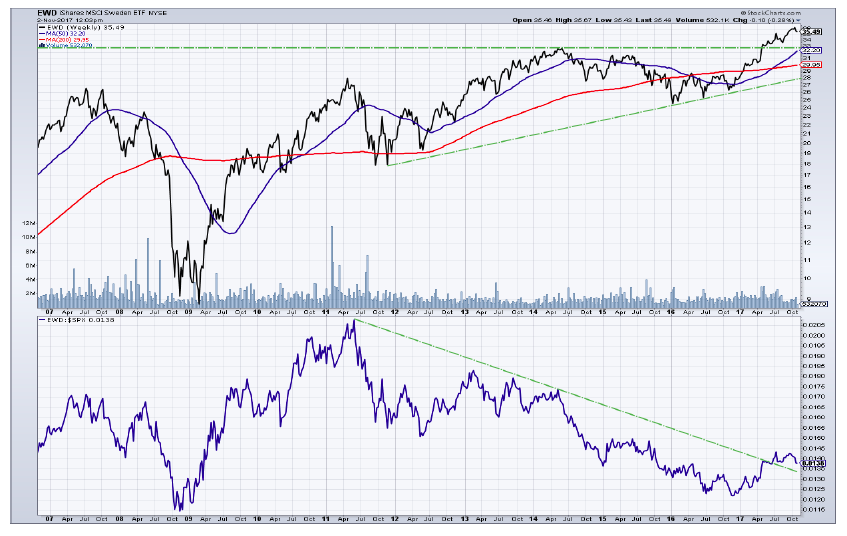
ISHARES MSCI SWEDEN ETF (EWD)
Bullish break from ascending triangle earlier this year, which was accompanied by heavy volume. RS break vs. “500” confirms price break. Well diversified.
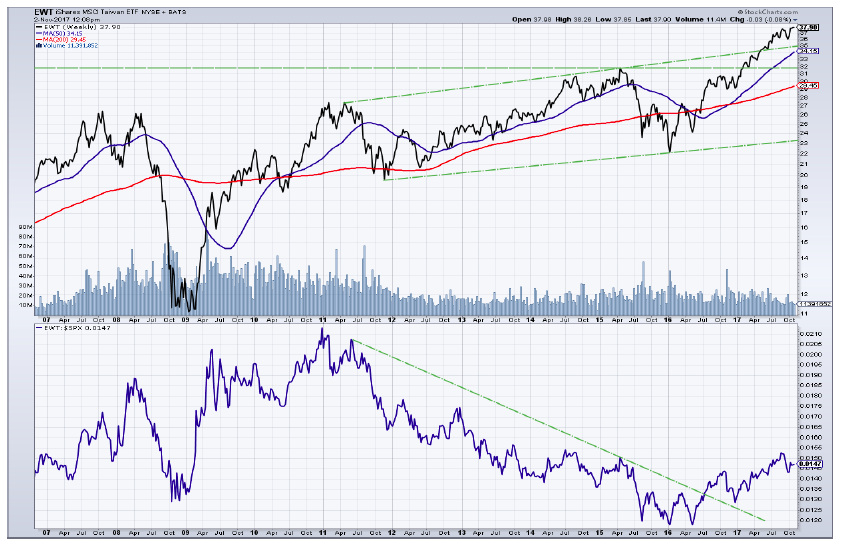
ISHARES MSCI TAIWAN ETF (EWT)
Bullish breakout to new highs and out of rising channel. RS vs. “500” has been in an uptrend since the middle of last year. Taiwan Semiconductor is 25% of ETF.
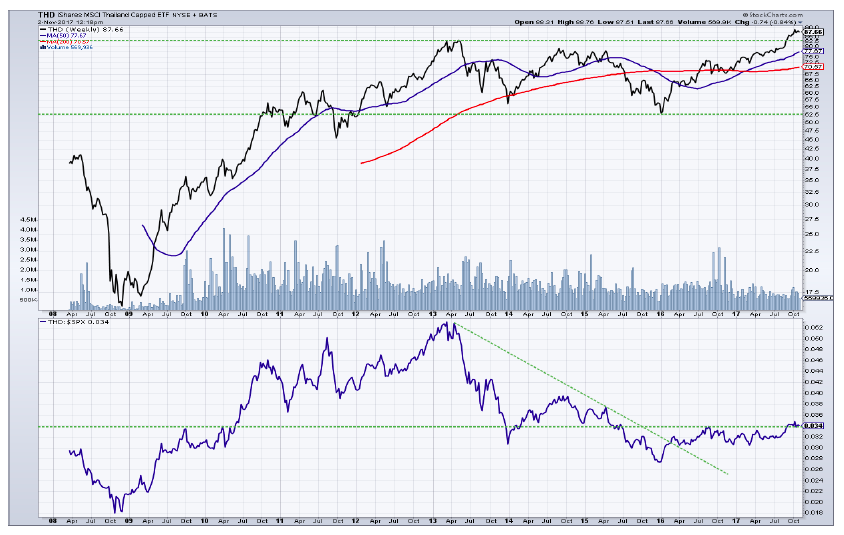
ISHARES MSCI THAILAND ETF (THD)
Bullish break from large multi-year price base in September. Trend in RS vs. the “500” flat, would like more strength. Well diversified.
Certainly, there are some interesting international ETF’s from a technical standpoint. I only have price and volume on these, but no breadth, no sentiment, etc. Sometimes, the simpler the technical analysis, the better. It is noteworthy that many of these bullish charts are just breaking out this year and potentially have a lot of catching up to do vs. the U.S. The last real S&P 500 breakout on a weekly chart was back in the middle of 2016. This leaves the “500” quite extended from its base vs. many of these international ETF’s just leaving their weekly base.
Twitter: @MarkArbeter
The author may have positions in related securities at the time of publication. Any opinions expressed herein are solely those of the author, and do not in any way represent the views or opinions of any other person or entity.


