This is an Intermarket Analysis chart review I provided to my fishing club members this past weekend to graphically represent relationships (strong and weak) which can foretell where stocks, sectors and indices might move next!
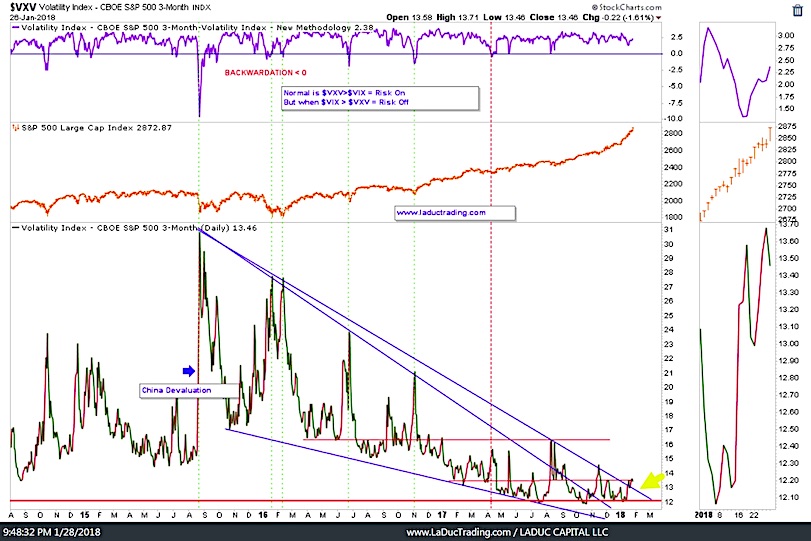
What happened to suppressing volatility? Volatility of volatility looks flat/basing for better part of a year. Careful.
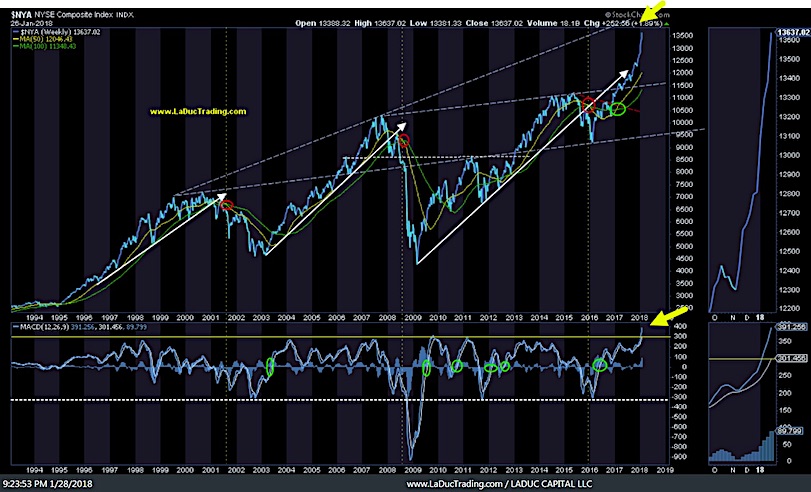
This has to be one of my favorite intermarket analysis charts. It got me long in May 2016 (see BIG at MIT PPT) and has me scratching my head since it burst through that yellow line in the lower MACD panel in January 2018. Careful.
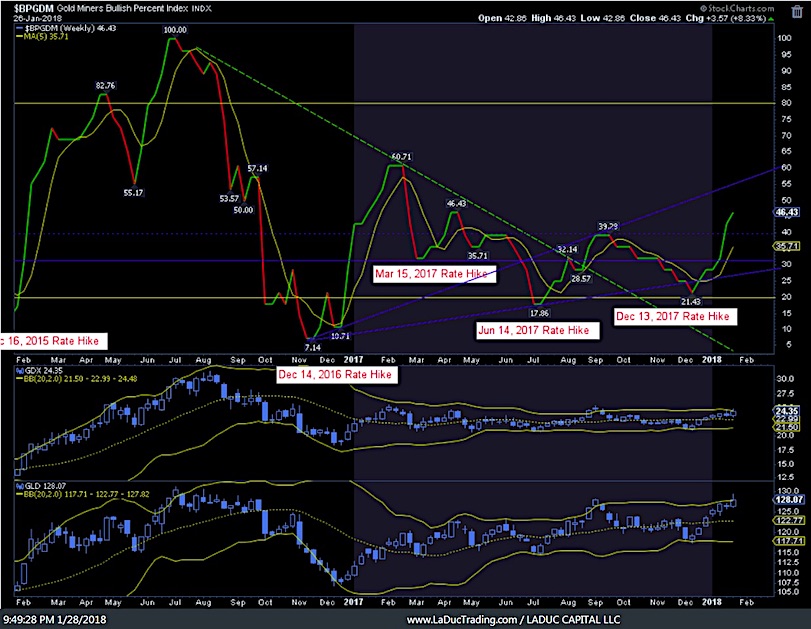
I recommended GLD/SLV/GDX long pre-FOMC, for reasons made self-explanatory below. Now I’m shorting Gold on a US Dollar bounce. What USD bounce? See the next few slides…
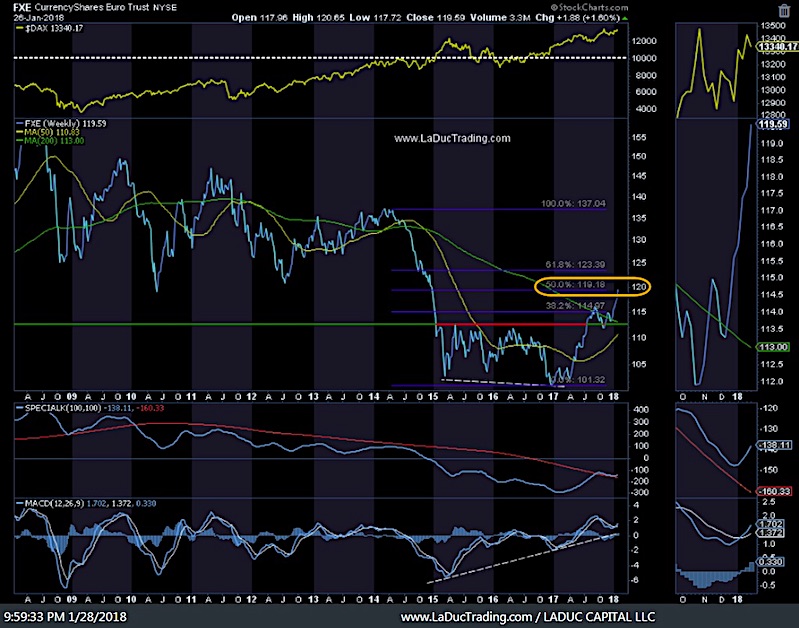
The Euro has reached the 50% Fibonacci target so where it heads next will greatly impact the US Dollar. Yes, Draghi trumps Trump.
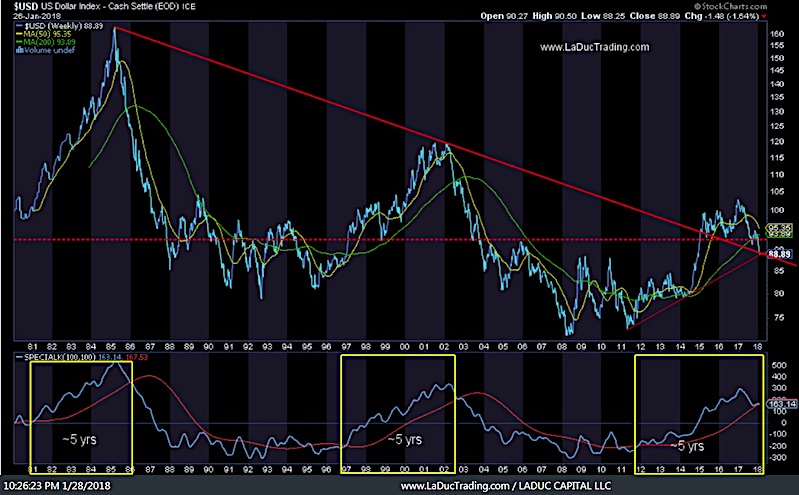
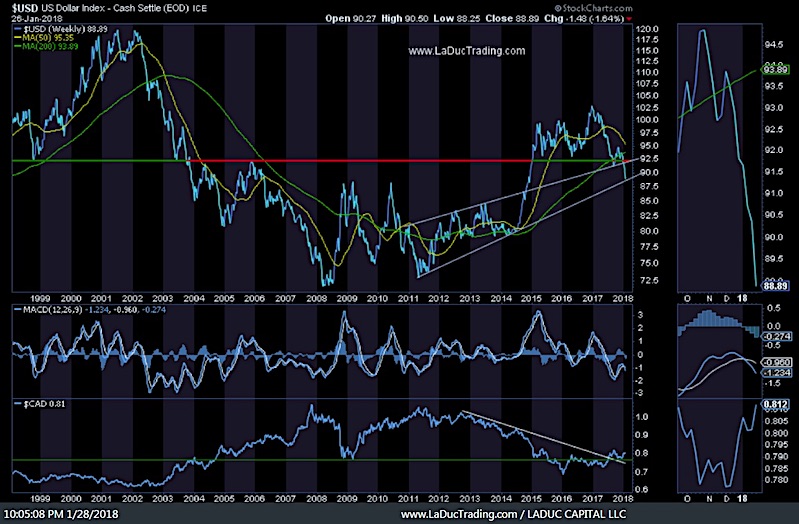
US Dollar – two perspectives: Both say a bounce is due.
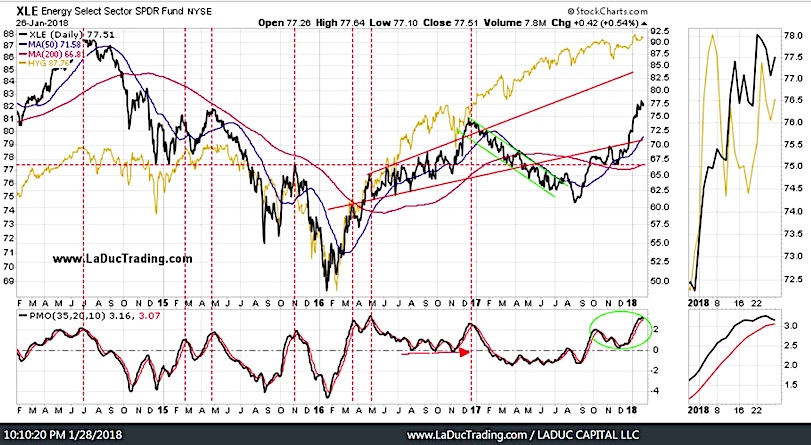
The Energy Sector (XLE) is starting to weaken, which would time nicely with a US Dollar bounce. Careful.
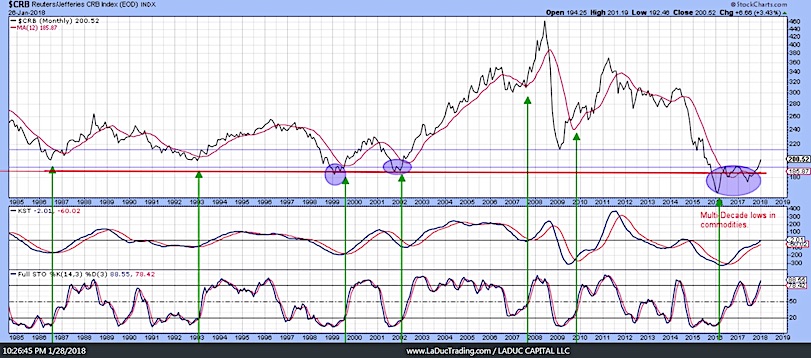
A bid in Commodities has been bid and then some, although a potential bounce in US Dollar will challenge this breakout. A retest is a good way to buy commodities again, later, to play the theme of higher rates and inflation. Might just want to wait until after the US Dollar is done bouncing. Careful.
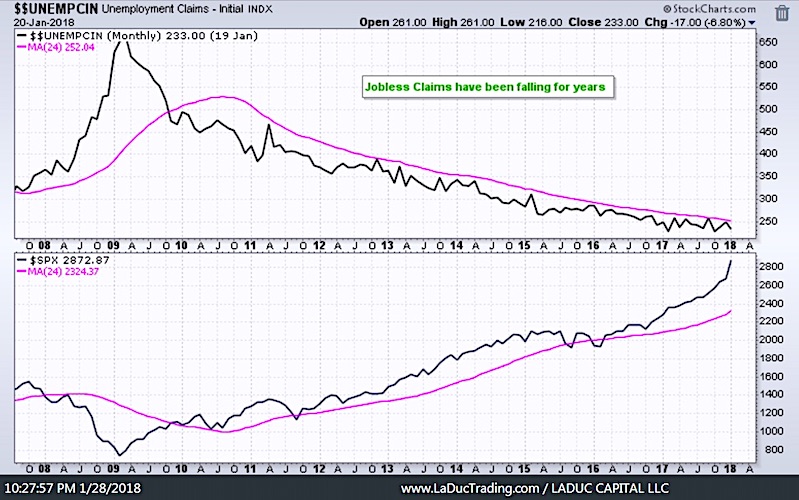
Final Thought: Friday is Non Farm Payrolls so this chart matters only/most when the break gets/stays above the pink line. CAREFUL.
Come join me… I made it super easy for you to trade with me: 1. Pop into my LIVE Trading Room any time you want. 2. Get real-time Portfolio tracking of my trades with SMS/Email. 3. Think big picture with my macro-to-micro investment newsletter. You can also subscribe to my Free Fishing Stories Blog/Videos and find me @SamanthaLaDuc. Thanks for reading and Happy Trading!
Twitter: @SamanthaLaDuc
Any opinions expressed herein are solely those of the author, and do not in any way represent the views or opinions of any other person or entity.

: Showing Some Signs of Emerging Strength")
