Key Investing Takeaways:
– The stock market is likely to anticipate the presidential election outcome.
– Incumbents lose when economic dissatisfaction is elevated.
– Interest rate cuts and weakening market breadth not consistent with economic strength.
2020 is poised to be a year of political noise. While the first votes in the primaries have not even been cast (that begins next week), we can expect politics to dominate the headlines between now and November (except, perhaps, for a 17 day break this summer to focus on the Olympics.)
We often think of markets and the economy reacting to presidential elections, as if the election provides an unforeseen outcome that must quickly be accounted for. More often, the discounting mechanisms at work in the stock market help anticipate election outcomes.
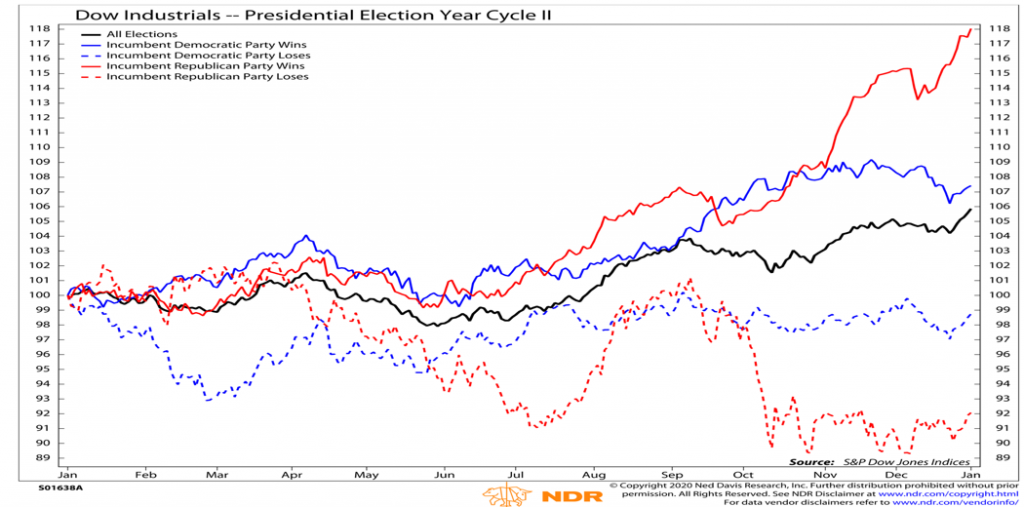
There has tended to be a high threshold for removing Presidents from office after just one term. When this does happen, the decision usually comes down to dissatisfaction with the direction of the economy. The pattern for all election years shows consolidation in the first half followed by a rally in the second half. This is a composite of stock market strength and resiliency in years when the incumbents have won and volatility and weakness in years when the incumbents have lost. In other words, the path of stocks over the first three quarters of the year could provide strong clues about the outcome of the November election.
See the chart below of the Dow Jones Industrial Average and Presidential Election Year Cycle.
The stock market tends to anticipate economic developments and re-election prospects hinge on views about the economy. According to Gallup, satisfaction with the way things are going in the U.S. has risen to its highest level since 2005 and economic confidence has reached its highest level since 2000.
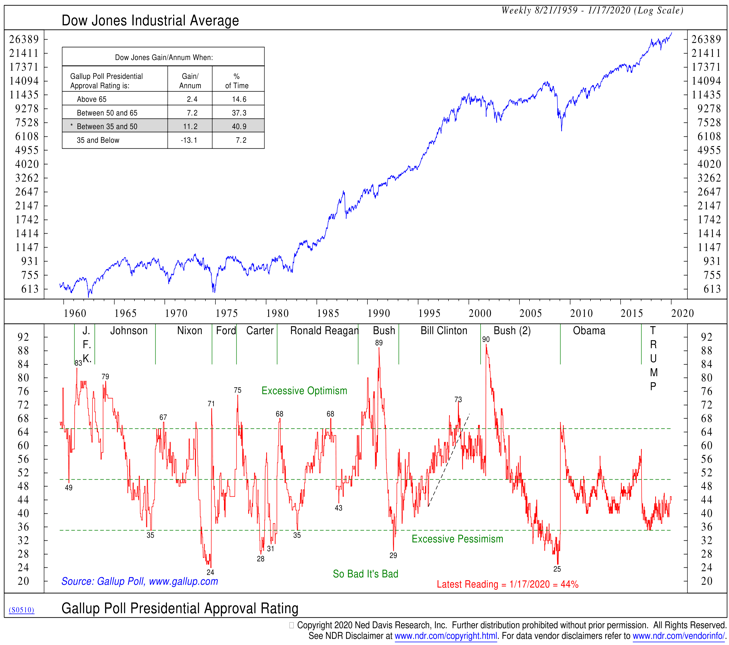
Whether on impeachment or re-election, President Trump is likely in safe territory as long as his job approval rating remains above 35%. President’s Bush and Carter (the last two to be turned out after only one term) and President Nixon (who resigned to avoid likely removal through the impeachment process) saw their approval ratings dip into the 20’s. As of mid-January, Trump’s approval rating was 44%, near the highest of his presidency.
Perception matters more than reality when it comes to economic data and how people feel. President Bush discovered this in 1992 as his claims of an improving economy went unheeded by the electorate (and in fact, his challenger made the economy a central focus of his campaign). For 2020, this means looking past specific data points about real activity and focusing on measures of confidence and whether the data is coming in better than or worse than expected. Right now the economic surprise indexes show the data has been surprising to the upside.
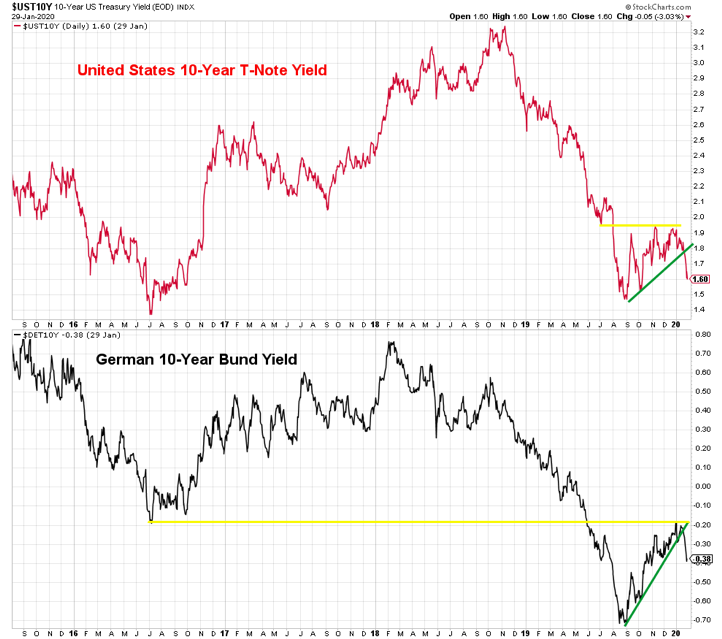
Market-based signals can also provide insight about election outcomes. Declining bond yields and the need for the Fed to lower rates ahead of the election could be hard to reconcile with the view that the economy is on a solid foundation. The yield on the 10-year T-Note has fallen from 1.90% at the beginning of the year to a recent low of 1.55% and odds of a rate cut in 2020 have soared in the past month. Rather than looking for further easing from the Fed, a better case for economic strength would be a persistent move higher in yields.
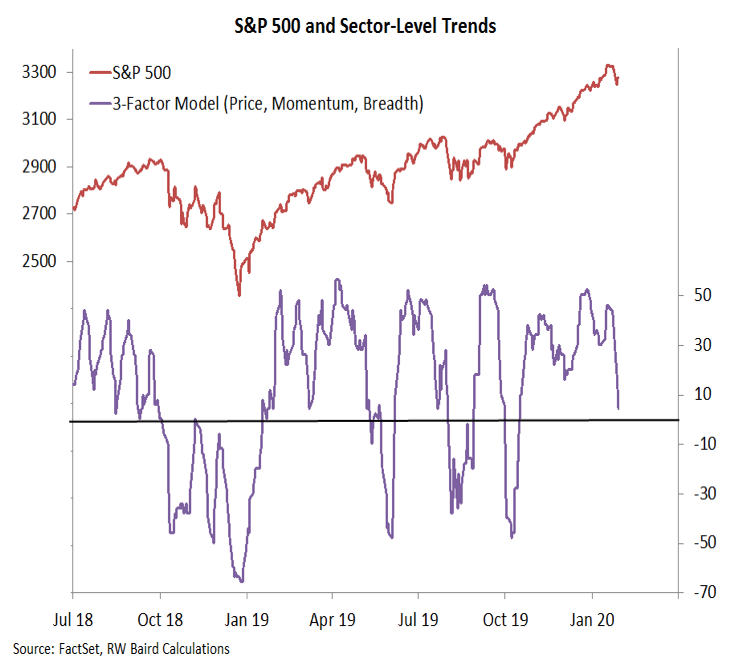
Political noise surrounding the electoral fortunes of various candidates and geopolitical uncertainties could keep index-level volatility running high this year. For indications of whether the stock market gyrations are noise or news, look beyond the indexes and focus on measures of breadth.
One example might be our indicator that looks at trend strength across the various sectors. This has weakened recently, but for now remains in positive territory. If this turns negative and remains depressed as we move toward summer, the prospects for meaningful index-level weakness likely rise, and with it the possibility of turn over at the White House.
Twitter: @WillieDelwiche
Any opinions expressed herein are solely those of the author, and do not in any way represent the views or opinions of any other person or entity.

: Showing Some Signs of Emerging Strength")

