During long-term bull markets (decades), shorter-term advances during the cycle expansions (often 2-4 years in duration) rise to a minor deviation from the long-term trend (200-week sma), or the mean (equilibrium) before correcting.
For broad stock indexes, the deviation generally reaches 30% – 40% above the 200-week simple moving average (sma) and for leading industry groups / sectors it can reach +/-50%.
Once the index, industry group or sector rallies to those levels it will pause through a corrective process or on occasion, decline to the vicinity of the 200-week sma (see the recent cyclical bear market) before discovering support.
If the advances reach 100% above the mean investors should consider the possibility of a bubble.
We will apply those metrics to some of the leading industry groups / sectors that have rallied to new price highs in recent days to evaluate the opportunity for further gains.
The ETFs cover cloud computing, biotechnology, tech-software sector, cyber security, internet, and online retail.
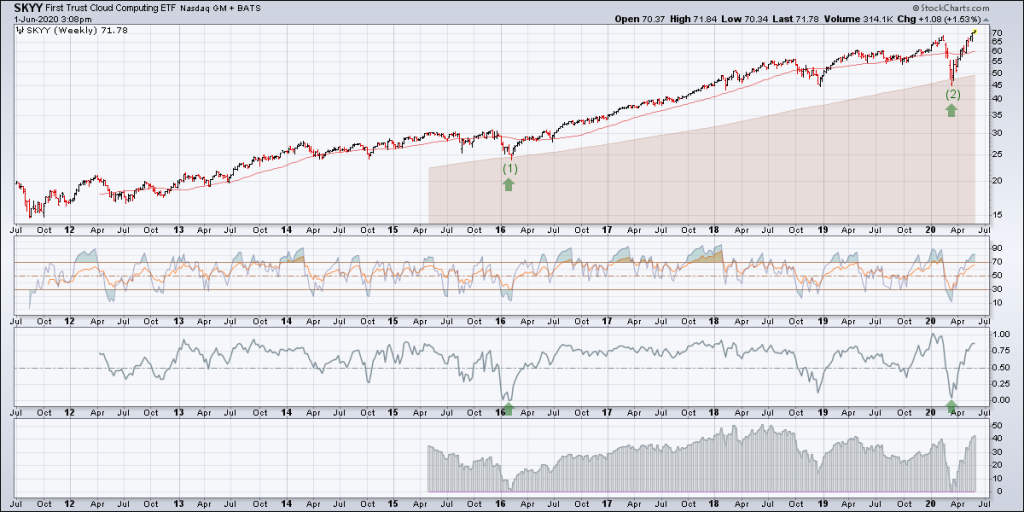
SKYY (First Trust Cloud Computing) – Weekly Chart
SKYY is currently trading just over 40% above equilibrium, but not the highest reading since the introduction of the fund. In 2018 it reached 50% before there was a mild correction. Potential for further upside in the short-term.
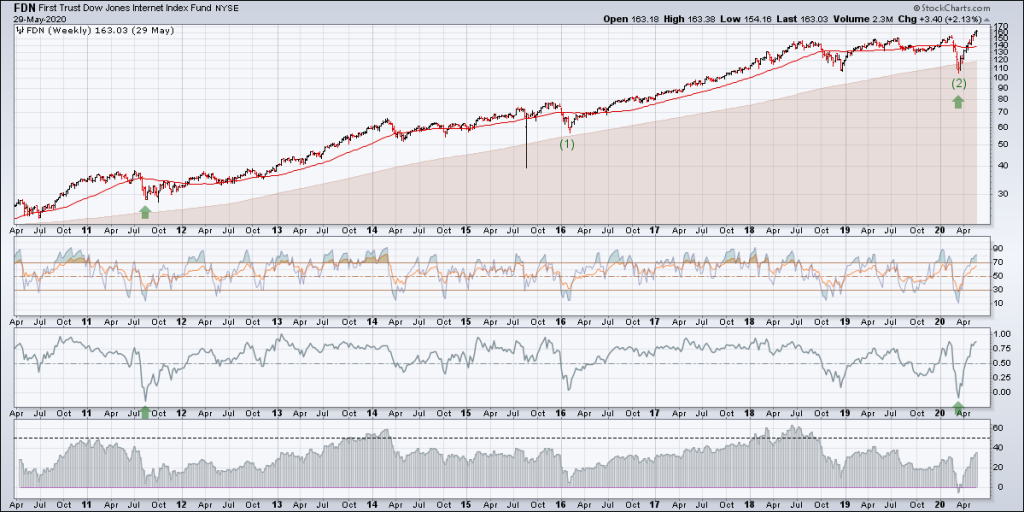
FDN (First Trust Dow Jones Internet Index) – Weekly Chart
Since the introduction of FDN it has established most short-term price highs in a wide range between 40% – 60% deviation from the 200-week sma. Currently, FDN still has room to rally.
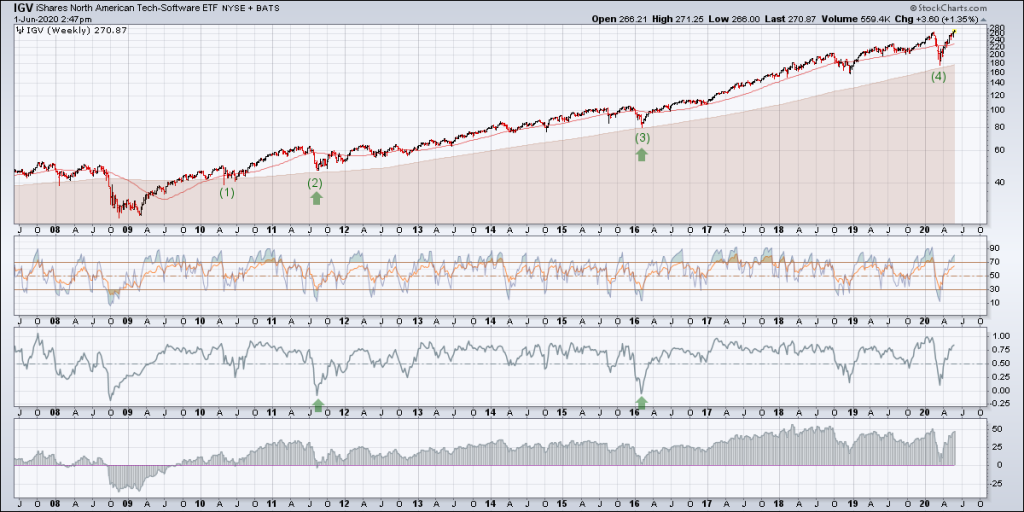
IGV (North America Tech – Software) – Weekly
IGV is trading near the highest deviation readings (50%) recorded in mid-2018 and early 2020. Potential for a short-term pause in the current cyclical expansion.
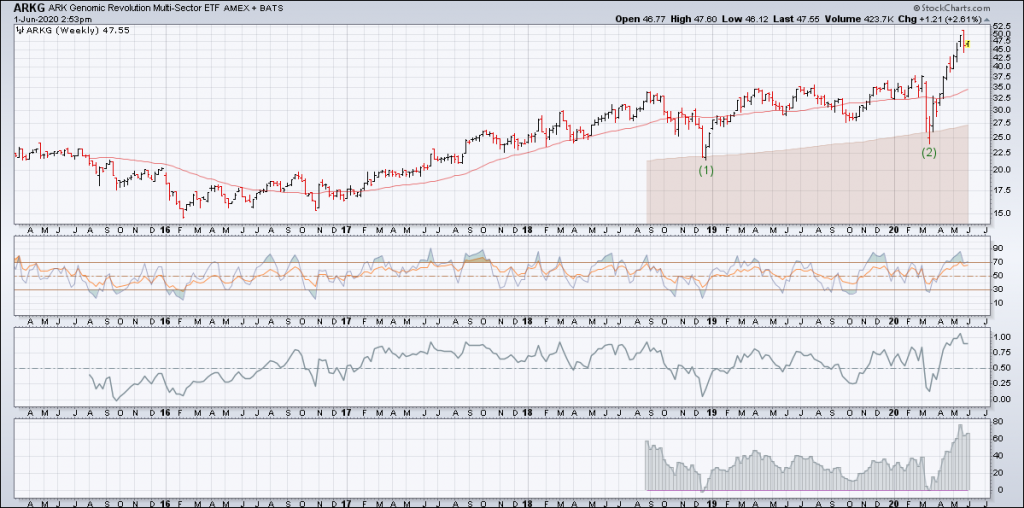
ARKG (ARK Genomic Revolution Multi-Sector) – Weekly
In mid-May ARKG registered an 80% deviation from the 200-week sma. An instrument needs to get over 100% before we begin to consider a bubble. The bearish outside week may mark the beginning of a corrective process for ARKG.
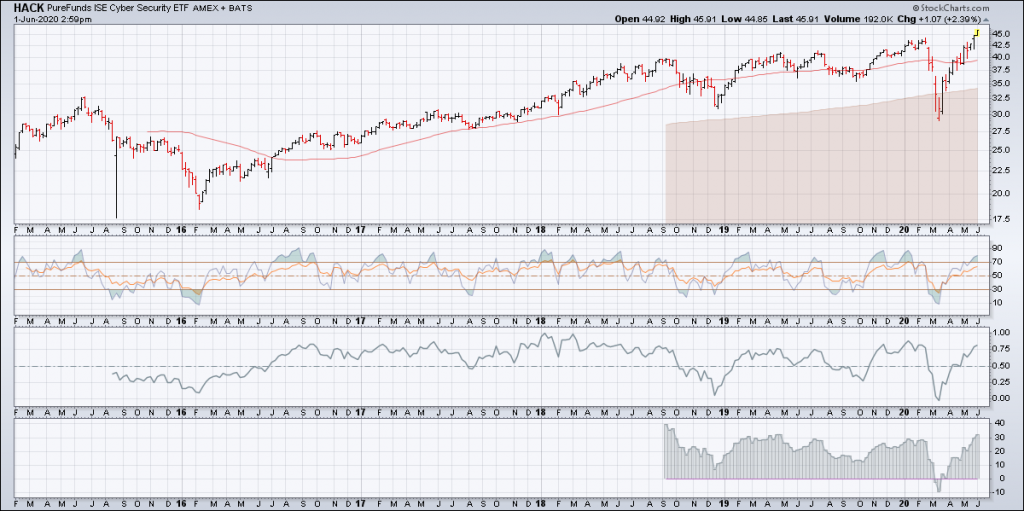
HACK (PureFunds ISE Cyber Security) – Weekly Chart
A relativity new ETF, HACK is trading at a similar deviation as in the first half of 2019 and early 2020, but well below the peak in September 2018. Leading groups tend to reach +/-50% before a correction, suggesting that HACK still has room to rally.
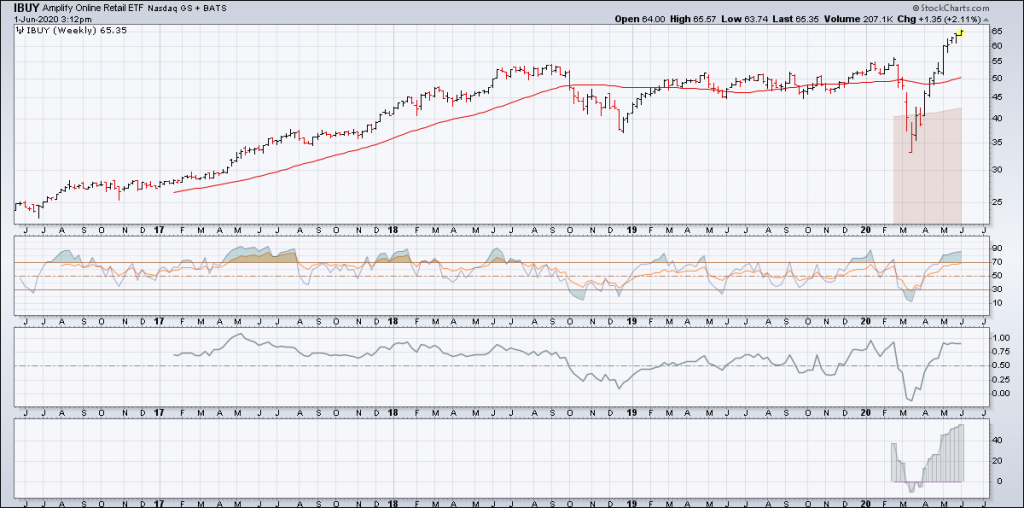
IBUY (Amplify Online Retail) – Weekly Chart
IBUY has reached the upper bound of a normal rally phase. Relatively new issues can be tricky because they still do not have a clear price tendency. On face value there is an above average probability that a corrective process will take hold soon.
After a historical rally from the March lows it is normal for some leading industry groups / sectors to flash overbought readings based on their deviation from the 200-week sma.
In the six ETFs mentioned above, three show room for further upside in the short-term and the other three have reached bounds that have defined the highs of a normal rally phase.
We anticipate a broad corrective process to emerge in the short-term (days-to-weeks), but the numbers suggest that there is enough residual buying pressure, particularly in software, for them to rally a little more.
Twitter: @hertcapital
The author may have a position in mentioned securities at the time of publication. Any opinions expressed herein are solely those of the author, and do not in any way represent the views or opinions of any other person or entity.


