The following is a recap of The COT Report (Commitment Of Traders) released by the CFTC (Commodity Futures Trading Commission) looking at futures positions of non-commercial holdings as of June 16, 2015. Note that the change is week-over-week.
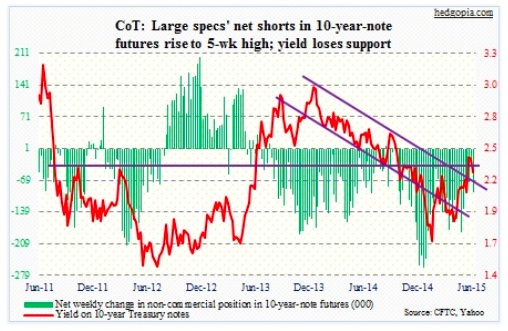
10-Year Treasury Note: Let us see if we can make some sense out of this week’s major developments. The FOMC met, and it looked like members were trying to appease both bulls and bears (in equities). The ‘dot plot’ suggests a majority of policymakers are leaving the door open for two rate hikes this year (hawkish). Concurrently, the expected pace of rate increases over the next two years slowed down from the April meeting (dovish).
So the key is in the ignition then? For real? While not casting doubt on the FOMC’s intention to begin raising later this year, it is worth noting that its own GDP forecast for this year fell – by quite a bit. The new range is 1.8 percent to two percent, down from previous 2.3 percent to 2.7 percent. Did the Fed miss a window of opportunity already? We will find out.
More and more it is beginning to look like it has painted itself into a corner. The Fed wants to – as a matter of fact, needs to – add arrows to its monetary quiver. But for that to happen, data needs to improve substantially in the second half. I have been saying all along the Fed will not move this year. It had plenty of opportunity last year, but instead decided to move the goal post. The 6.5-percent unemployment target was met last year.
At least for now, the bond market acts confused. The iShares 20+ Treasury Bond Fund (TLT) sold off on Wednesday and Thursday but rallied strong on Friday.
Per the COT Report data, non-commercials are betting rates are headed higher, raising net shorts to a five-week high.
Currently net short 96.4k, up 59.9k.
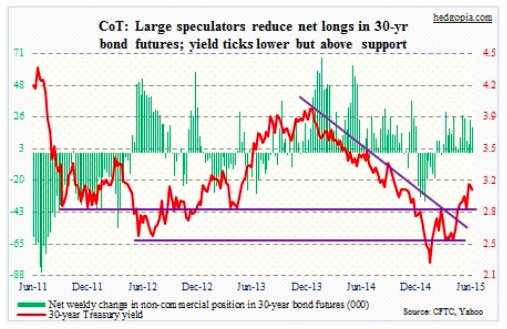
30-Year Treasury Bond: Next week’s economic calendar includes the following.
Sales of both existing and new homes will be released for May – on Monday and Tuesday respectively. Existing home sales fell 3.3 percent in April. Nonetheless for the first time since last February the 12-month rolling average rose to five million units. The trend is similar in new home sales. The 12-month rolling average stood at 471,000 units – the highest since December 2008. In three of the last four months, sales of new homes have come north of 500,000 units, with April at 517,000. This is positive. What could potentially throw a monkey wrench into this? Of late, mortgage rates have spiked. Price already has.
Also on Tuesday, the advance report on durable goods for May will be released. After they peaked last September at $74 billion, new orders for non-defense capital goods ex-aircraft – a proxy for business capital expenditures – have lost momentum, down in three of the last four months month-over-month; year-over-year, they are down for three straight months.
GDP is on Wednesday. This will be the third and final estimate for 1Q. The second estimate showed real GDP shrank 0.7 percent (at a seasonally adjusted annual rate). The second quarter is performing much better, though. As of June 16, the Atlanta Fed’s GDPNow model is forecasting 1.9-percent real GDP growth. Also on Wednesday, a revised estimate of 1Q corporate profits will be out. Corporate profits, adjusted for inventory and capital consumption, were $2 trillion in 1Q15, down from an all-time high of $2.17 trillion in 3Q14.
Personal income for May is scheduled for Thursday. Probably the most watched number in this series is the PCE deflator – the Fed’s preferred inflation gauge versus the consumer price index. The CPI has been growing much faster in recent months. PCE, on the other hand, is subdued, with core PCE up 0.11 percent month-over-month in April and up 1.2 percent year-over-year. The last time it rose at two percent annually was back in April 2012.
There is just one Fed official scheduled to speak – on Friday. Last week, there were just three, including Chair Yellen’s press conference.
Currently net long 18.1k, down 5.3k.
Crude oil: Inventory dropped 2.69 million barrels for the week ended June 12, for a total 467.9 million barrels. Last week, it declined 6.8 million barrels. The trend is good. If one has to nitpick – gasoline inventories rose 460,000 barrels. As well, crude oil stocks at Cushing, OK, rose for the first time since April. This took place even as refinery utilization fell, which has the potential to reverse the recent declining trend in crude oil inventory. Worth watching.
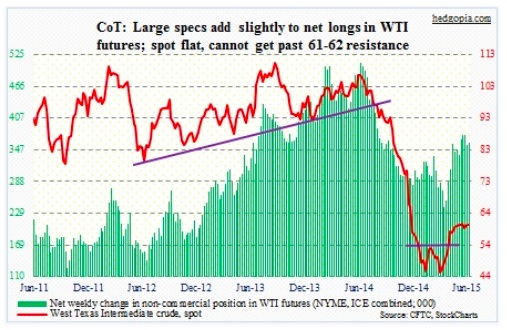
The 61-62 resistance was tested again this week – unsuccessfully. Since May, this level has repelled rally attempts 11 times. The range-bound action continues – seven weeks and counting.
COT report data shows that non-commercials are staying with their sizable net longs.
Currently net long 360.7k, up 5.1k.
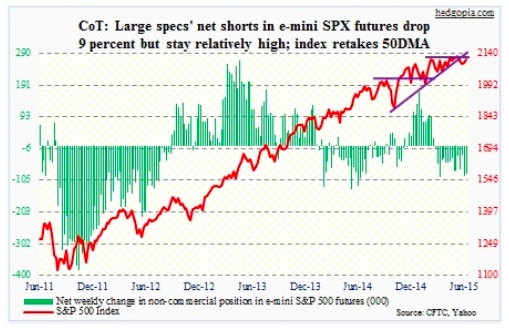
E-mini S&P 500: U.S. companies are not allowed to repurchase shares from five weeks prior to releasing quarterly numbers to about 48 hours of reporting earnings. Given how actively companies have been buying back shares, this is a headwind for stocks for sure. Not to mention several elevated valuation metrics!
In two weeks the second-quarter earnings season begins. Could it act as a potential tailwind?
As of June 11, second-quarter operating-earnings estimates for S&P 500 companies stood at $28.51. Four months ago, this was $29.99, and $33.61 at the end of 3Q14. Is the bar low enough for companies to jump over? We will find out soon. By the way in the first quarter, the bar was lowered but turns out not low enough. At 2Q14, 1Q15 estimates were $32.18, which then gradually dropped to $26.77 right before 1Q ended. When it was all said and done, 1Q registered $25.80. But stocks rose anyway.
By the way, NAAIM members’ average exposure to stocks was 58.6 in the latest week – lowest since October 22, 2014. Back then it bottomed at 10 in the middle of that month, when stocks bottomed. In the meantime, Investors Intelligence’s bulls dropped to 45.5 percent this week – lowest since October 21, 2014, when it read 35.3. So who is buying? Retail? Nah. The AAII bullish count this week was a mere 25.4 percent.
And then we learn that stock funds took in $10.8 billion in the week ended June 17, $5.7 billion of which went into the SPDR S&P 500 ETF (SPY) – courtesy of EPFR. Bond funds lost $10.3 billion.
Non-commercials are not as sanguine in recent COT Report data – they are staying with their rather large net shorts.
Currently net short 84k, down 8.8k.
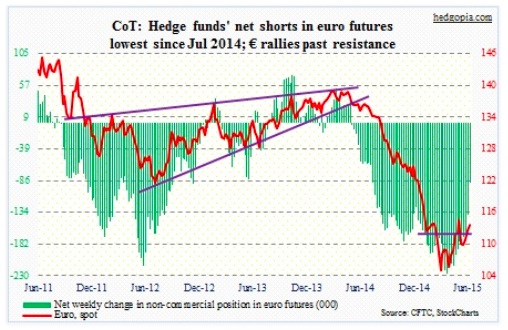
Euro: The ECB told a meeting of euro zone finance ministers Thursday that it was not sure if Greek banks would be able to open on Monday (courtesy of Reuters). Nonetheless, the euro is not behaving as if Europe has a crisis at hand as far as Greece is concerned. The day before Greece elections in January, the euro was trading at $1.123. Friday, it closed at $1.137. The bond market is not showing any panic either. Peripheral spreads started to widen this week, but not a whole lot. A case of whistling past the graveyard or Mr. Draghi’s 2012 ‘whatever it takes’ pledge at work? Or it may simply be this – the hard deadline for Greece is not until June 30, when its bailout agreement ends and payment is due to the IMF.
Who else is not buying a crisis scenario? Per the COT Report, non-commercials, who reduced net shorts to the lowest since last July.
Currently net short 89.4k, down 48.6k.
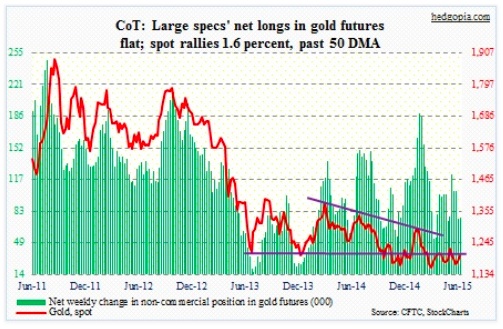
Gold: The euro is signaling the Greece situation will have a happy ending. At the same time, someone is seeking protection in gold. Gold rallied nicely in the week, up 1.6 percent. It retook its 50-day moving average, but is below the 200, which is 0.7 percent away.
Non-commercials did not make any changes to their net Gold longs in the recent COT Report, even though holdings are substantially below late-January highs.
Currently net long 75.7k, up 633.
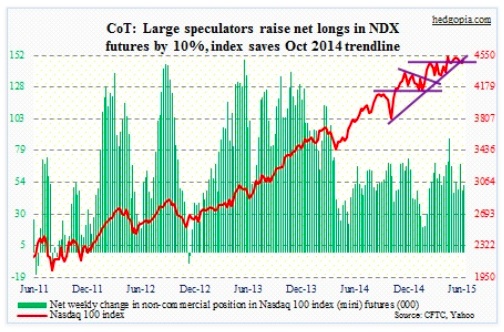
Nasdaq 100 index (mini): Thursday was historic! The Nasdaq Composite surpassed the intra-day high of 5132.52 reached in March 2000. The new number to beat: 5143.32. No such luck for the Nasdaq 100. No new record. The intra-day high back then was 4816.35, which is 6.7 percent away.
For the week, AAPL, which makes up nearly 15 percent of the index, failed to perform, losing 0.5 percent. The good thing is, unlike the S&P 500, the Nasdaq 100 has not lost its October 2014 trendline.
Non-commercials remain optimistic.
Currently net long 52.6k, up 4.9k.
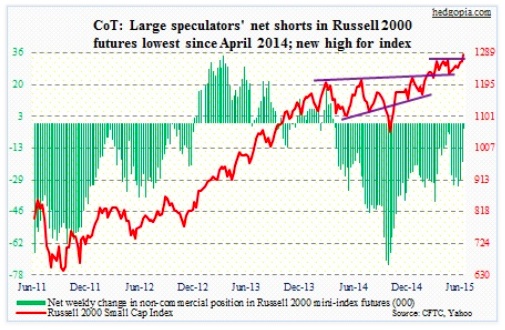
Russell 2000 mini-index: Kudos to small-cap bulls and their persistence! For three months, they held on, buying the dips, in the process creating one after another weekly hammer. Finally, there is a breakout.
Non-commercials saw this one coming. Looks that way. By Tuesday, they had cut net shorts to the lowest since April last year.
They probably got the cue from RVX, the Russell 2000 Volatility Index, which once again on Monday was rejected at resistance at 18, which also approximates its 200-day moving average; from that point on, it was all downhill for the volatility index.
Currently net short 2.8k, down 17.3k.
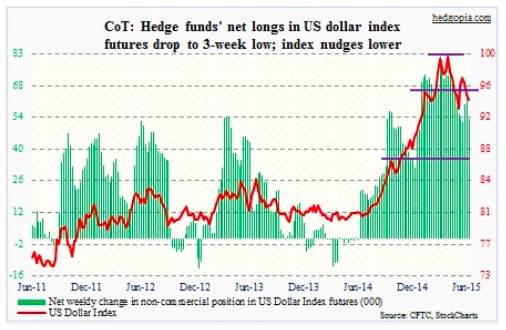
U.S. Dollar Index: The FOMC statement was treated as dovish. The dollar index sold off 0.8 percent on Wednesday. It was essentially flat until 2PM.
One of the reasons for the dollar’s strength is competitive devaluation policy adopted by both the Bank of Japan and the European Central Bank. In Japan in particular, exporters have benefited hugely. Is the currency tailwind beginning to wear off? You wonder. In May, Japan’s export volumes fell 4.1 percent month-over-month. Exports also dropped in April. In May, exports to the U.S. dropped the most – down 8.5 percent m/m.
Non-commercials cut back net longs – now down 34 percent from early-March highs.
Currently net long 53.4k, down 9.5k.
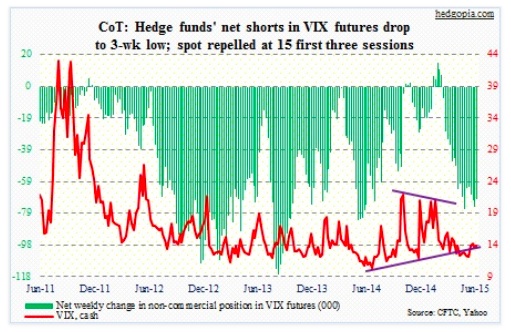
VIX: The count is now 16. That is the number of days the Volatility Index (VIX) has been rejected at 15 since April. This week alone, volatility bulls tried to take that out Monday-Wednesday, but in the end they were nothing but wasted opportunities. Come Thursday, the spot got hit hard, and equities surged.
Per the COT Report, non-commercials’ net shorts fell a tad, but their holdings continue to be sizable.
Side note: Demand for VIX calls has picked up the past couple of weeks.
Currently net short 69.7k, down 4.7k.
Thanks for reading.
Twitter: @hedgopia
Read more from Paban on his blog.
No position in any of the mentioned securities at the time of publication. Any opinions expressed herein are solely those of the author, and do not in any way represent the views or opinions of any other person or entity.

 Testing Important Price Support")
: Cup (and Maybe Handle) Watch")

