The Russell 2000 Index (INDEXRUSSELL:RUT) has quietly put together a multi-day winning streak. This all sounds well and good, but this follows a multi-week decline and general weakness in the high beta arena.
So the question we all want to know: Is the Russell 2000 (RUT) bottoming?
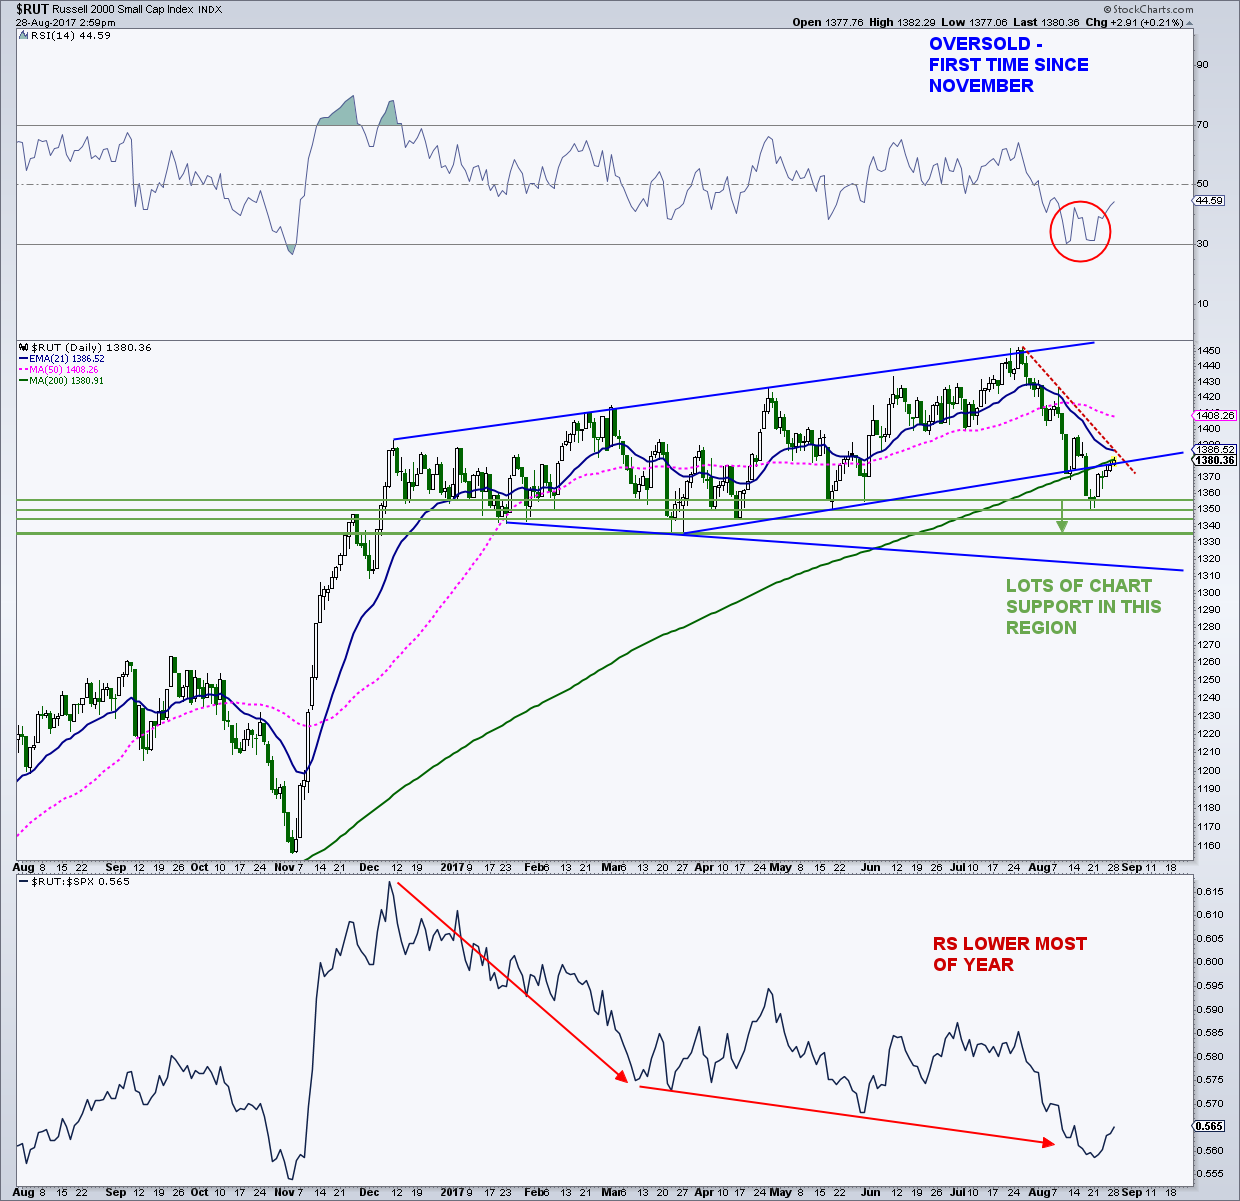
The well-followed small caps index declined nearly 7.0% from its July 25 closing high, and still remains around 5 percent from those highs. The decline took the RUT down to an area of very strong chart support between 1,335 and 1,355 and saw its 14-day RSI cycle into oversold territory (30 or below) for the first time since November.
So what do we make of this bounce?
Well, the chart is a mess with big time price support below as well as big time resistance overhead. To turn this ship around, the RUT needs to reclaim (and hold) its 200-day moving average around 1,381 as well as trendline resistance and the 21-day exponential average near 1,388. That’s a trio of stiff resistance.
With more than a 6% decline, a potential bottom is likely to take a little time and not take the shape of a “V.” And if 1,335 gives way, that could potentially be very bearish and allow for more Russell 2000 weakness. Stay tuned.
Russell 2000 “daily” Chart
Feel free to reach out to me at arbetermark@gmail.com for inquiries about my newsletter “On The Mark”. Thanks for reading.
Twitter: @MarkArbeter
The author may have positions in related securities at the time of publication. Any opinions expressed herein are solely those of the author, and do not in any way represent the views or opinions of any other person or entity.


")


