Over the past 18 months, I’ve penned several articles about traceable commodity breakouts and rising commodities prices… and inflation risks.
With each breakout came more inflation pressures. And today, we continue to battle high energy, food, and housing prices.
But what if I told you there was a chance that inflation is peaking? Crazy right?
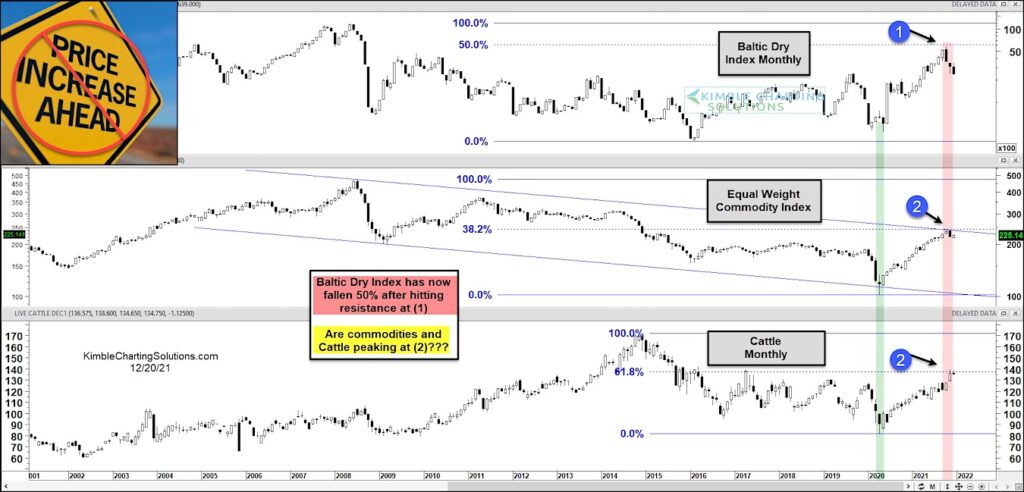
Well, today’s chart 3-pack highlights important commodity price indices that may be peaking: The Baltic Dry Index (shipping costs), the Equal Weight Commodity Index, and Cattle prices. Note that these are all long-term “monthly” charts.
Sign of Inflation Peaking?
All 3 indices have returned to key Fibonacci resistance levels. The Baltic Dry Index reached its 50% Fibonacci retracement at (1) and turned lower (to the turn of 50%). And the Commodity Index and Cattle could be peaking out at (2), also key Fibonacci retracement levels.
If resistance holds for commodities, then there is a good chance that prices will stop rising in the months ahead. Keep an eye on these indices. Stay tuned!
Baltic Dry Index, Equal Weighted Commodity Index, and Cattle Price Charts
Note that KimbleCharting is offering a 2 week Free trial to See It Market readers. Just send me an email to services@kimblechartingsolutions.com for details to get set up.
Twitter: @KimbleCharting
Any opinions expressed herein are solely those of the author, and do not in any way represent the views or opinions of any other person or entity.
 Trading Near Top Of Price Range")
 Reaches Important Price Support")
 Exhaustion Price Candle")