Commodities were already in a slump when coronavirus hit in 2020. That crash sent commodities to the lowest levels in decades.
A quick economic rebound led to a return of demand which in turn lead to shortages in 2021 and into 2022.
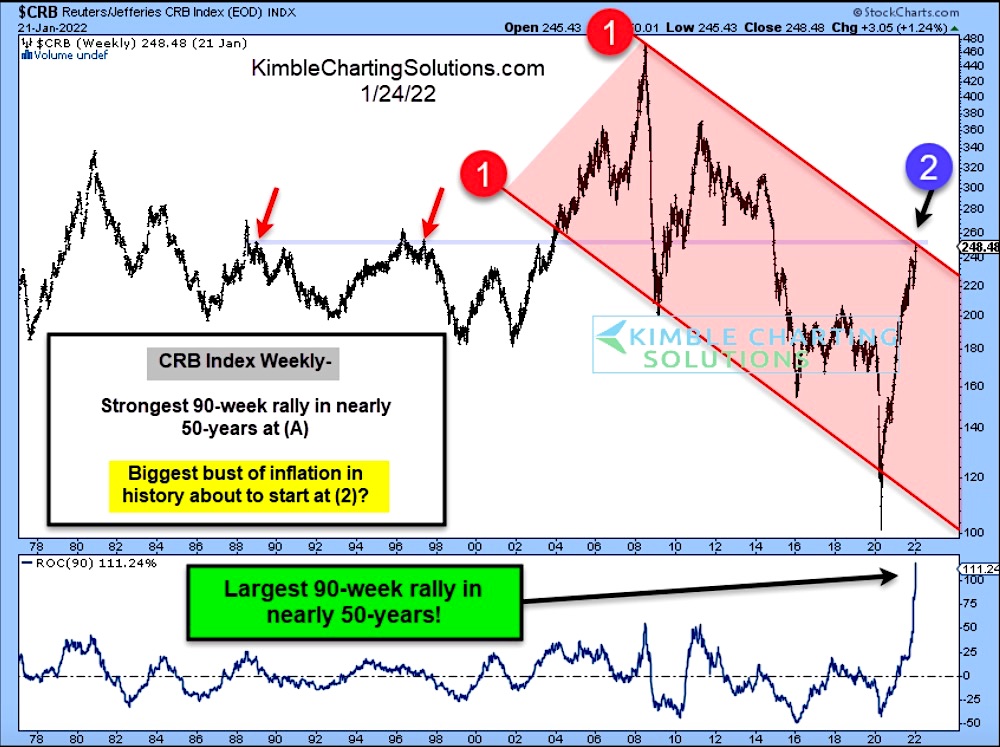
So now what? Well, if you look at today’s long-term “weekly” chart of the CRB Commodity Index you can see that the past 2 years produced the largest 90-week rally in nearly 50 years!
This has taken commodities from the bottom of the falling channel (marked by each 1) to the top of the channel.
Which starts here? Deflation or Hyperinflation?
The rally has commodities testing important dual resistance at (2). This resistance is a combination of lateral resistance from past peaks along with the falling overhead channel.
A breakout would put inflation concerns front and center. However, a sharp turn lower may produce the biggest bust of inflation in history. Keep an eye on what happens at (2). Stay tuned!
CRB Commodity Index “weekly” Chart
Note that KimbleCharting is offering a 2 week Free trial to See It Market readers. Just send me an email to services@kimblechartingsolutions.com for details to get set up.
Twitter: @KimbleCharting
Any opinions expressed herein are solely those of the author, and do not in any way represent the views or opinions of any other person or entity.

: Cup (and Maybe Handle) Watch")
 Trading Near Top Of Price Range")

