Well rounded investors and traders need to understand what’s happening across asset classes. If money is coming out of one asset class, it’s likely to flow into another one.
Right now, equities are red hot as the stock market is making new all time highs… almost daily it seems. At the same time, bonds have been moving up and down for most of 2017.
Today we’ll look at the uncertainty in the bond market. Much of that uncertainty has to do with the economy and investors trying to figure out the inflation puzzle.
On Wednesday, the Federal Reserve raised interest rates. This was a sign that the economy is improving. However, a well know inflation indicator is still subdued, making investors wonder why the Federal Reserve is raising rate. Either way, this conundrum might explain why the bond market is trading in limbo this year.
The inflation indicator that I like to follow is a ratio of Treasury Inflation Protected Securities ETF (NYSEARCA:TIP) to the 20+ Year Treasury Bond ETF (NASDAQ:TLT). A quick reminder: when the TIP/TLT ratio is headed lower, inflation is of less concern… and when it is rising, it is of higher concern.
The TIP/TLT inflation gauge is trading below a key down trend line and currently testing technical support. See chart below.
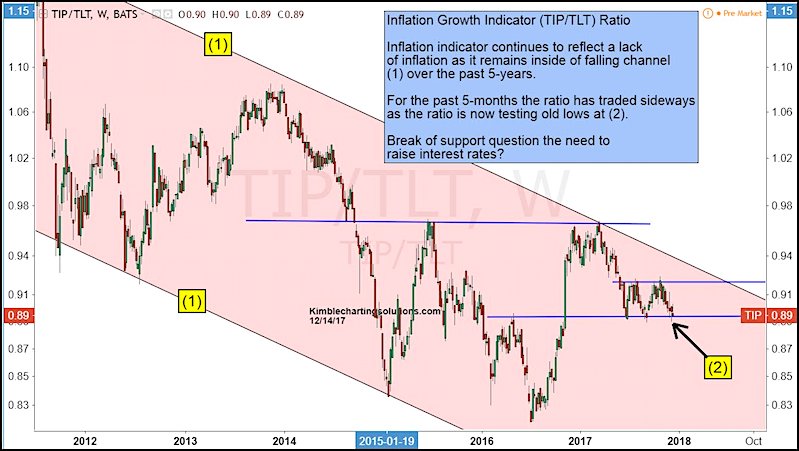
Investors will have to wait to see how this shakes out. A break lower could signal that the Federal Reserve will halt rate increases, while a breakout above the trend line would likely signal more hikes and a strengthening economy.
Twitter: @KimbleCharting
Any opinions expressed herein are solely those of the author, and do not in any way represent the views or opinions of any other person or entity.


