Part one of this article discusses the potential ramifications related to policy actions that China and Japan might take. These large U.S. Treasury bondholders could temporarily upset the Treasury market, but as we opined, we do not think they threaten our forecast for lower yields.
Like China and Japan, inflation, deficits, and QT are stories bond bears are telling themselves to justify higher yields in the future.
Part 2 focuses on the inflation outlook, burgeoning fiscal deficits, and QT. Like China and Japan, any of the three factors we discuss in this article can briefly upset the bond market. But we do not see inflation, deficits, or QT as a cause of concern for longer-term bond bulls.
Inflation Expectations
Some are starting to worry that inflation is beginning to rise again. For example, Lawrence Summers shares the graph below, implying that prices will ramp back up.
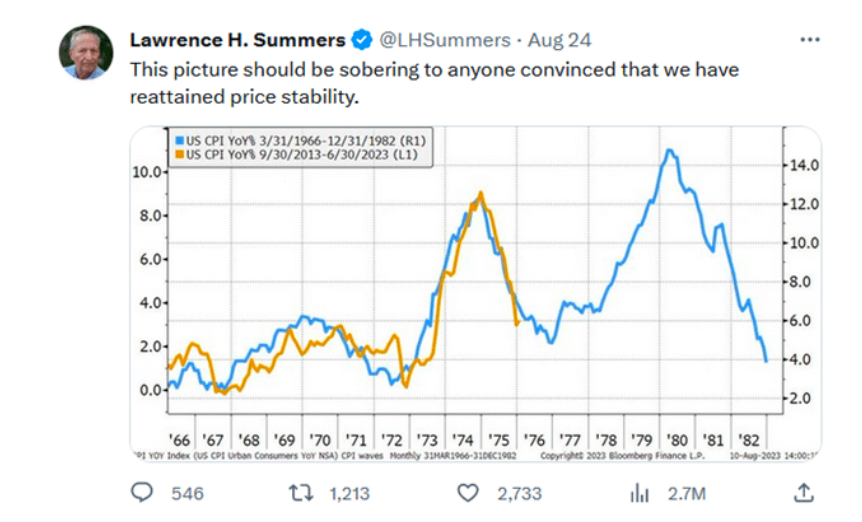
Given the symbiotic relationship between bond yields and inflation, bearish bond traders are taking notice of new inflation worries. Gasoline, home prices, and some other goods and services are again on the uptick.
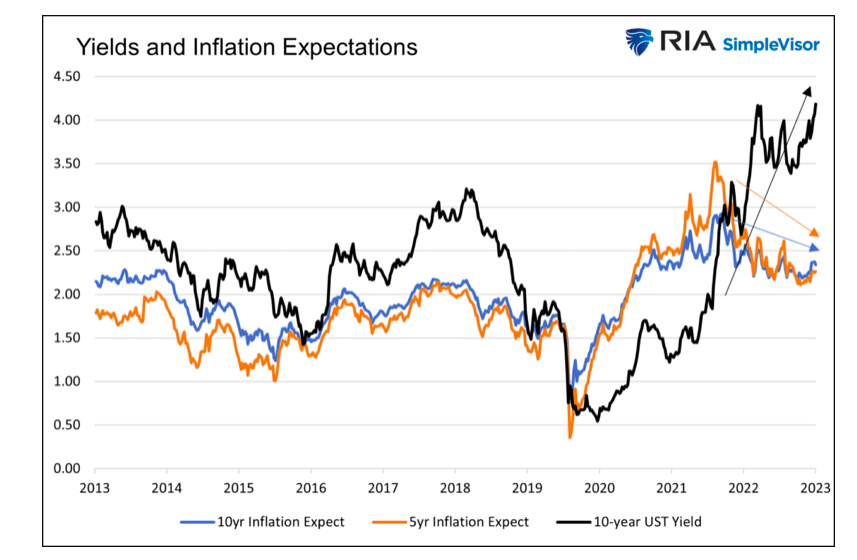
While some may be concerned about higher prices, implied inflation, as determined by the bond markets, displays no such fear. As we share below, five- and ten-year inflation expectations continue declining despite bond yields rising sharply.
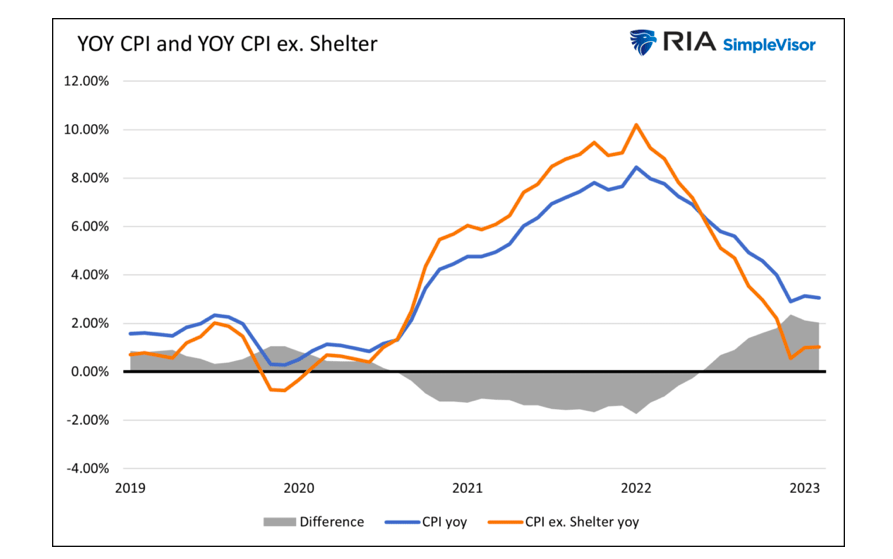
CPI will likely continue lower as lagged inflation reporting on shelter costs will catch up to reality. As we wrote in Is Inflation Already At The Fed’s Target? :
CPI with realistic OER and rent prices would be lower than the CPI excluding shelter numbers graphed above. Ask yourself:” What would Fed monetary policy be if inflation was at the Fed’s target?”
The quote references the following graph showing that CPI excluding shelter is 1.019%.
Bottom line:
We think inflation readings will be lower in six months, albeit may bounce around current levels for a few months before declining. While some think inflation will rise, the markets, in aggregate, have no such concern as we share with implied inflation rates. Therefore, it’s tough to pin the recent yield increases on inflation expectations.
Debt and Deficits
Do federal deficits and associated debt issuance correlate with bond yields?
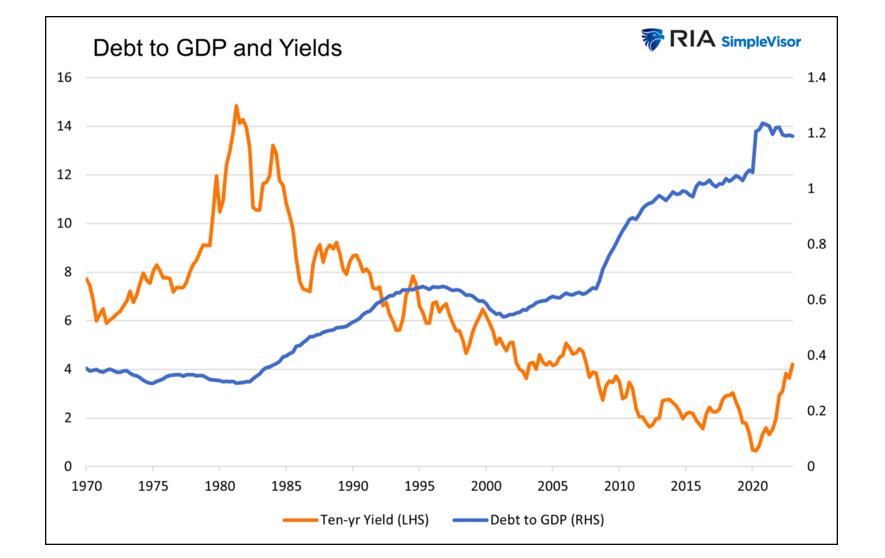
While many fear sharply increasing deficits will push yields higher, history argues the opposite. Since 1980, yields have fallen precipitously while debt to GDP has increased. Why?
Per Hoisington Investment Management’s latest quarterly update:
Estimates from econometric studies of highly indebted industrialized economies indicate that the government expenditure multiplier is positive for the first four to six quarters after the initial deficit financing, then turns negative after three years. This implies that a dollar of debt financed federal expenditures will, ‘at the end of the day,’ reduce private GDP.
In other words, today’s stimulus is tomorrow’s burden.
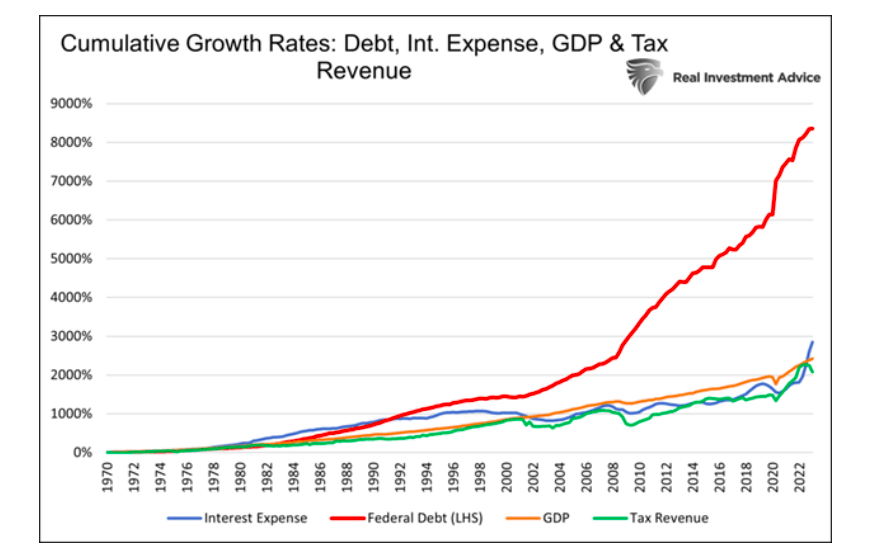
Government debt is onerous. Since it is growing much quicker than tax revenue, lower interest rates are required to keep interest expenses affordable for the Government. Further, the burgeoning debt will reduce economic growth and inflation in time. As we show, debt has grown much faster than GDP, tax revenues, and federal interest expenses. However, due to higher interest rates, interest expense has grown more in the last three years than in the fifty years prior. The recent trend is unsustainable!
Bottom Line:
The market may rightly fret that more debt will increase yields. However, history argues the opposite. The Fed and Treasury know that issuing new debt and rolling over existing debt can’t be done much longer at higher rates. In early August, The Treasury Department announced that it was comfortable letting the share of bills outstanding increase above the recommended level to 22.4%. In other words, they are trying to avoid locking in higher rates for longer.
QT
The Fed is likely to continue QT even after they pause rate hikes. This means that bonds on the Fed’s balance sheet today must find a new home. While that may appear to be a bearish factor for bonds, it’s worth noting the Fed is not selling long-term bonds. They are only letting maturing bonds roll off their balance sheet. In fact, each month, they are a net buyer of long-term bonds. The Fed needs to buy bonds when the amount of their maturing bonds exceeds the $95 billion monthly objective.
The regional bank crisis resulted from banks having to realize losses on long-term bonds and loans. Those assets and their unrealized losses are still on bank balance sheets. The Fed is aware that higher yields risk reigniting the bank crisis. Do not be surprised if the Fed or Treasury initiates some yield control if rates increase. As we said in the deficits section, neither the Government nor the economy can afford higher rates. For more, read our article- The Government Can’t Afford Higher for Longer.
Bottom Line:
QT is a short-term measure employed to normalize the Fed’s balance sheet. We have little doubt that when the time comes, the Fed will again aggressively buy bonds to reduce interest rates and limit the financial fallout of higher rates.
They will do whatever it takes when the time comes!
Summary
Like any other financial asset, bond yields trade up and down minute by minute. The media and investors tell stories explaining each move. But often, gyrations are simply a temporary imbalance of buyers and sellers. China, Japan, inflation, deficits, and QT are frightening stories and headlines. But as we share in this article and its predecessor, they should not worry bond bulls willing to endure short-term yield volatility for significant long-term reward.
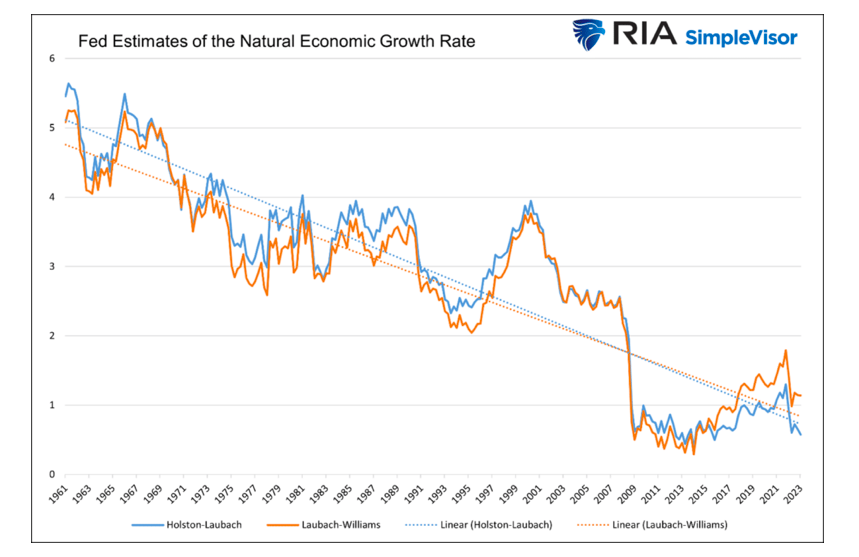
No doubt, the bearish factors in this article are concerning. That said, we think they dwarf compared to the opportunity that bonds present. Currently, 10-year notes yield 3% more than the long-term trend economic growth rate and trend inflation. The graph shows the natural economic growth rate is likely around 1%. Earning 4% or more in a 1% economy is the best yield premium bond investors have been paid in well over 20 years. The real question bond holders need to ask themselves is, are the 60-year economic trends in the graph reversing higher? If yes, rethink bonds. If not, get them while they are cheap!
Twitter: @michaellebowitz
The author or his firm may have positions in mentioned securities at the time of publication. Any opinions expressed herein are solely those of the author, and do not in any way represent the views or opinions of any other person or entity.


