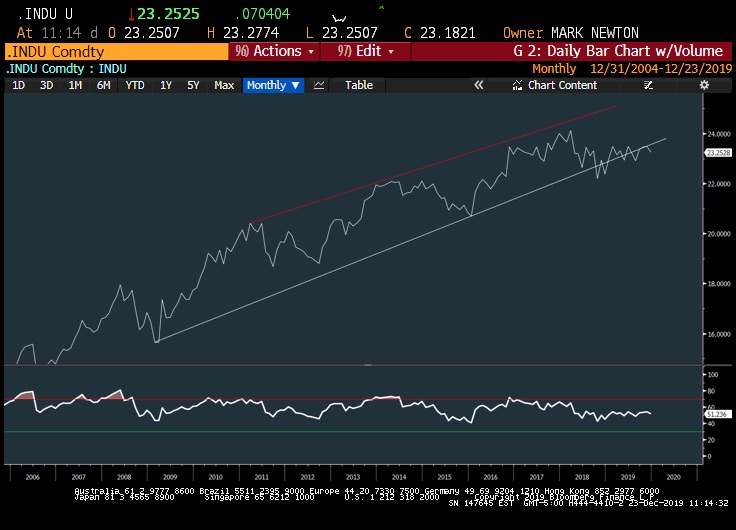
Industrials / Commodity Chart Analysis
The broader Dow Jones Industrials INDEXDJX: .DJI have been slowly but surely showing some relative weakness of late.
It’s important for investors to remain patient and watch out for evidence of this longer-term trend breaking in the chart ratio of XLI (Industrials) to SPY (S&P 500 ETF) before getting bearish.
While the Aerospace and Defense group looks attractive, along with Machinery, the multi-conglomerates are a tougher area to favor (outside of GE, which is gradually bottoming).
Air Freight and Transports as a whole have also been difficult and 2019 has seen its fair share of Industrial names like FDX, MMM and BA all show pretty blatant underperformance this year, along with many of the Airlines (think AAL).
Overall, Industrials lagged in 2017, 2018 and now 2019 and one has to be selective before getting too aggressive in this sector.
Let’s talk briefly about the S&P 500 and it’s outlook into year-end (short-term).
S&P 500 Index Trading Outlook (3-5 Days)- Bullish
There is no evidence of any technical weakness.
Prices are still trending higher.
We would need to see a move under 3191 on the S&P 500 Index to take a bearish stance. That said, tactical traders may look to sell above 3250 into year-end.
If you have an interest in seeing timely intra-day market updates on my private twitter feed, please follow @NewtonAdvisors. Also, feel free to send me an email at info@newtonadvisor.com regarding how my Technical work can add alpha to your portfolio management process.
Twitter: @MarkNewtonCMT
Author has positions in mentioned securities at the time of publication. Any opinions expressed herein are solely those of the author, and do not in any way represent the views or opinions of any other person or entity.


