COVID headlines are finally improving out of India. The world’s second-largest population at 1.4 billion was struck hard by the pandemic this past spring, but hopefully the situation is on the mend for the last time.
Their financial markets and economy might be last among the major nations to re-open and return to strong growth, but the world’s 6th largest economy plays a significant role in global GDP.
On the investing front, traders know the Sensex and Nifty 50 as the major Indian equity markets. As the U.S. honored Memorial Day, the Nifty 50 settled at a record high for the third straight session.
US investors have several options when it comes to investing in this leading market (data via FactSet and ETF Database):
iShares MSCI India ETF (INDA) – tracks a market cap weighted index of the top 85% of firms in the Indian securities market. It has $5.5 billion in assets under management and $167 million of daily dollar volume. The expense ratio is 0.69%. It is 26% Financials plus Real Estate and 17% Technology.
WisdomTree India Earnings Fund (EPI) – tracks a total market index of Indian companies with strong earnings. It is weighted toward value companies versus other Indian ETFs. EPI has $836 in AUM and daily dollar volume of $25 million. The expense ratio is 0.84%. It is 28% Financials plus Real Estate and 18% Technology.
iShares India 50 ETF (INDY) – tracks a market cap weighted index of 50 blue chip companies on the National Stock Exchange of India. It has $674 million in assets and $2.5 million of dollar volume per day. The expense ratio is 0.93%. It is 38% Financials plus Real Estate and 17% Technology.
Invesco India ETF (PIN) – tracks an index of Indian stocks screened for yield and earnings quality. It is cap weighted with a max position of 10% per company. It has $110 AUM and daily dollar volume of $1.1 million. The expense ratio is 0.78%. PIN is more tech-focused with 21% in IT and 15% in Financials plus Real Estate.
I like to look at the biggest ETF. INDA’s $5.5 billion in net assets easily makes it the largest. Like everything else, shares of INDA have surged since late March 2020. It has moved from near $20 to the mid-$40s to make new all-time highs.
INDA Weekly Since Inception (StockCharts)
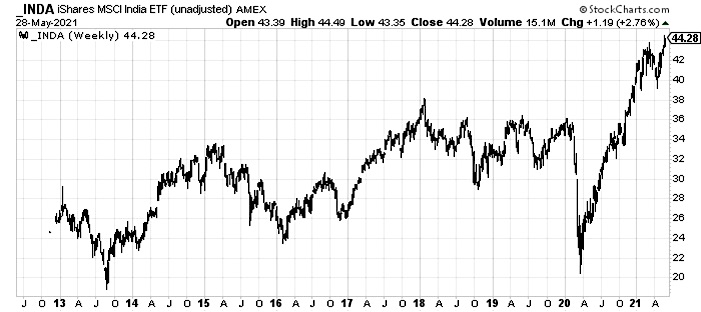
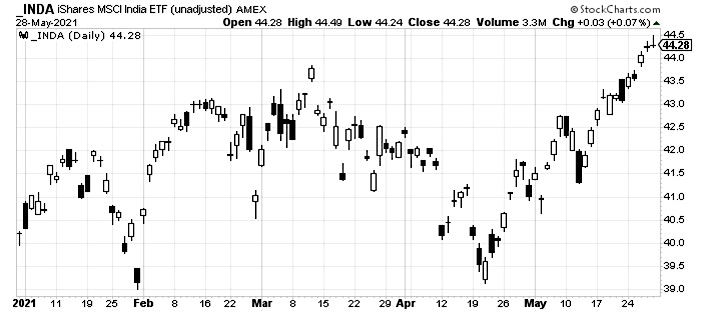
Near-term, INDA finally broke above the March peak. Fans of chart patterns would call for a price target to $48.50 based on the decline off the March high to the April low, and subsequent recent breakout. Fibonacci afficionados would point to the 1.618% extension off that move which comes into play near $46.80.
INDA YTD Daily (StockCharts)
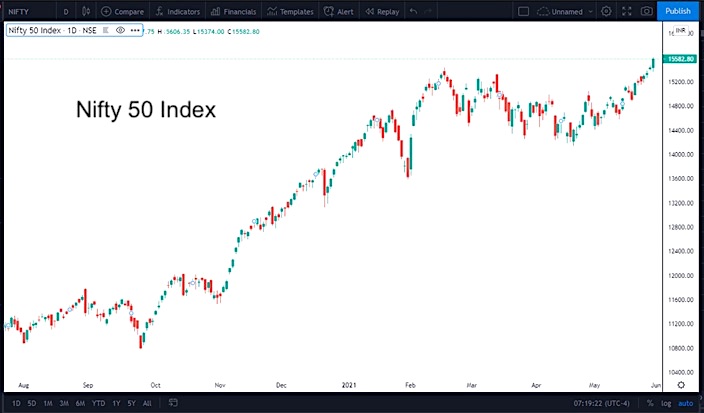
It’s also helpful to look at the India stock market itself. The Nifty 50 Index also closed at a fresh all-time high to close out May.
India’s Nifty 50 Index Since Last July (TradingView)
What does it mean for investors? Emerging markets could be on the road to recovery after three months of underperformance. While the Chinese stock market was the main culprit for EEM’s and VWO’s recent woes, India’s weakness from February through April took its toll on the EM index. May featured EM beating US equities, however. More could be on the way this summer.
I am a Chartered Financial Analyst (CFA) and Chartered Market Technician (CMT). I have passed the coursework for the Certified Financial Planner (CFP) program. I look to leverage my skills in a consultant role for financial advisors – that could be portfolio analysis, planning, writing etc. Please reach out to me at mikeczaccardi@gmail.com for more information. Connect on Linkedin.
Twitter: @MikeZaccardi
The author may hold positions in mentioned securities. Any opinions expressed herein are solely those of the author, and do not in any way represent the views or opinions of any other person or entity.
: Creating Bullish Divergence?")


: Creating Bullish Divergence?")