While most global stocks topped at the beginning of 2018, some markets recovered… and some did not.
For instance, the major U.S. stock market indexes have fought back to make new highs, while Emerging Markets and Developed markets outside the U.S. continued struggle.
Strength in the U.S. Dollar combined with a strong bias toward U.S. stocks have the rest of the world feeling left out.
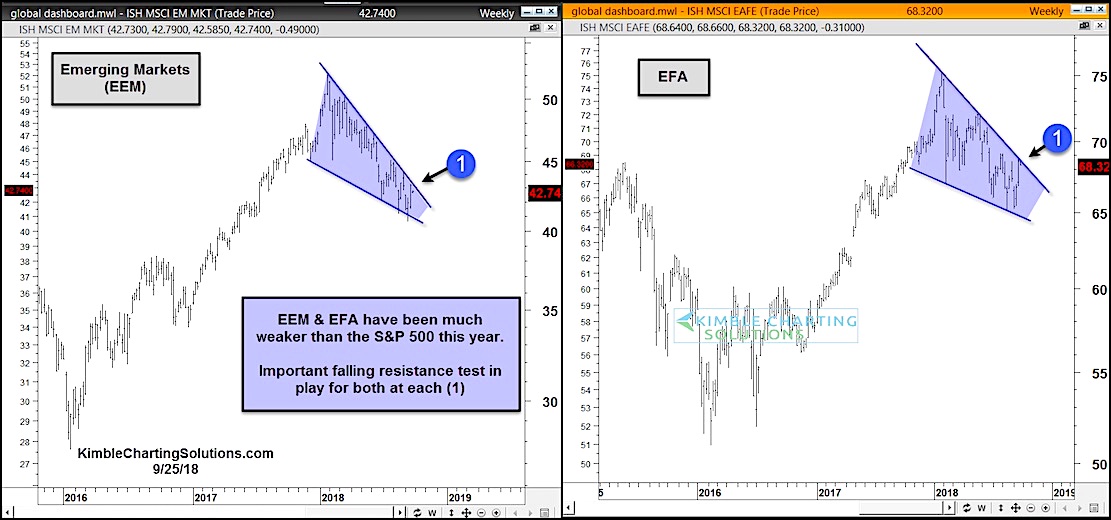
In today’s 2-pack of charts, we look at the iShares MSCI Emerging Markets ETF (NYSEARCA: EEM) and iShares MSCI EAFE ETF (NYSEARCA: EFA) to get a glimpse at what’s happening outside the U.S. And perhaps what’s to come.
Both ETFs have been much weaker than the S&P 500 (NYSEARCA: SPY). For that to change, these ETFs need to break out of the current downtrend. EEM and EFA are testing important falling resistance at point (1).
Stay tuned to this pattern – it should tell investors if/when there is a trend change.
Emerging Markets ETF (EEM) and EAFE ETF (EFA) Charts
Note that KimbleCharting is offering a 30 day Free trial to See It Market readers. Just send me an email to services@kimblechartingsolutions.com for details to get set up.
Twitter: @KimbleCharting
Any opinions expressed herein are solely those of the author, and do not in any way represent the views or opinions of any other person or entity.


: Showing Some Signs of Emerging Strength")
