Nasdaq 100 Index to Nasdaq Composite “Ratio” Chart
Tech stocks have been the clear leader of the stock market recovery rally.
But within the ranks of leadership, and important ratio may be sending caution to investors.
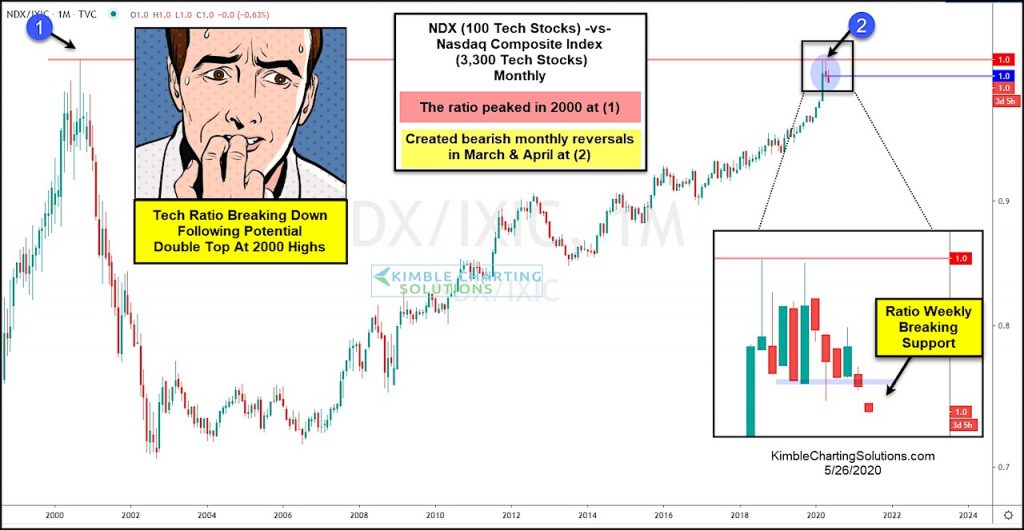
In today’s chart, we look at the ratio of large cap tech stocks (the Nasdaq 100 Index) to the broader tech market (the Nasdaq Composite) on a “monthly” basis.
The large cap concentrated Nasdaq 100 (only 100 stocks) has been the clear leader for several years versus the Nasdaq composite (3300 stocks)… but that theme appears to be sending a concerning signal to the market.
As you can see on today’s chart, this important tech ratio peaked in 2000 at (1). And a prolonged bear market followed.
Early this year, the ratio re-tested the 2000 peak at (2), while recording back to back monthly bearish reversals in March and April. This raises concerns of a potential double top.
Note as well that on a “weekly” basis the ratio is breaking down this week. This is definitely worth watching, especially for stock market bulls. Stay tuned!
Note that KimbleCharting is offering a 2 week Free trial to See It Market readers. Just send me an email to services@kimblechartingsolutions.com for details to get set up.
Twitter: @KimbleCharting
Any opinions expressed herein are solely those of the author, and do not in any way represent the views or opinions of any other person or entity.


