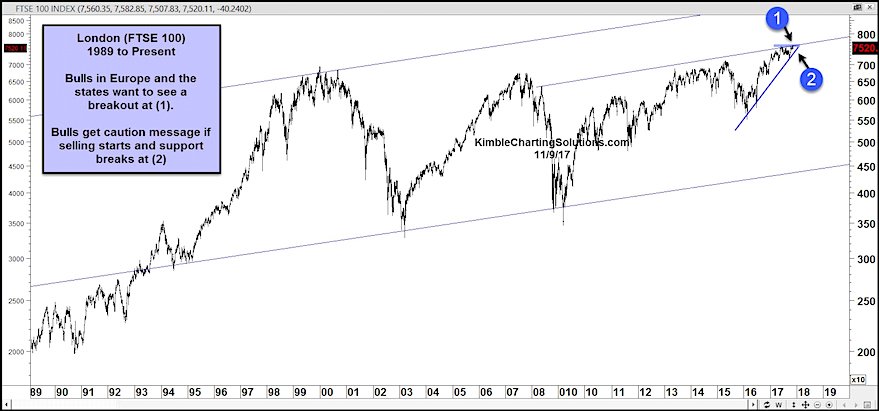
Two international stock markets that have interesting charts right now are London’s FTSE 100 Index (INDEXFTSE:UKX) and France’s CAC40 Index (INDEXEURO:PX1).
Both have been in rally-mode this year… but both European stock market indices are reaching important price levels.
Looking at the charts below, you can see that both markets are in up-trends and bullish from a broader perspective. We can also see that both stock indices are testing overhead price resistance. And this could trigger a pullback or correction… or breakout. Worth putting on your radar.
On the FTSE 100 Index chart, we can see how strong the market has been off the early 2016 lows. That rally is now hitting the top-side of a 10 year price channel and is getting squeezed underneath by the up-trend line.
A breakout at point 1 would be very bullish for the FTSE 100 and Europe (and U.S. for that matter). On the flip side, a breakdown here would send caution to investors.
FTSE 100 Chart
Similar setup on the CAC40. This price channel has produced pullbacks two other times. Third time a charm?
Pay attention. Europe looks important here.
CAC40 Chart
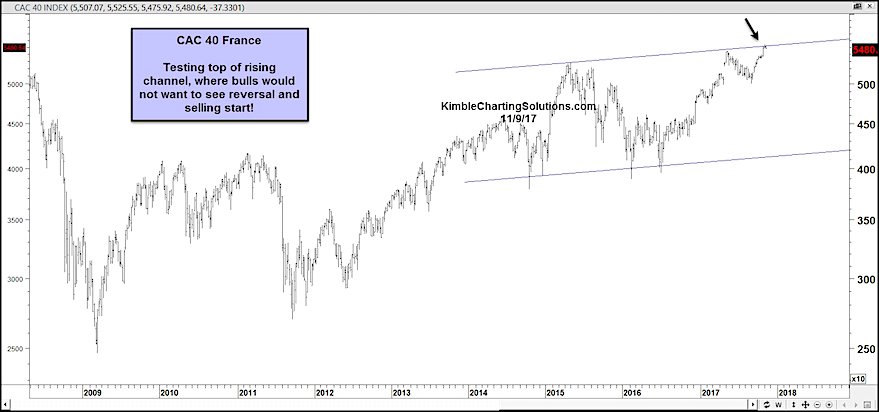
These two indices are important to the broader European equities spectrum so stay tuned.
Twitter: @KimbleCharting
Any opinions expressed herein are solely those of the author, and do not in any way represent the views or opinions of any other person or entity.

: Showing Some Signs of Emerging Strength")
