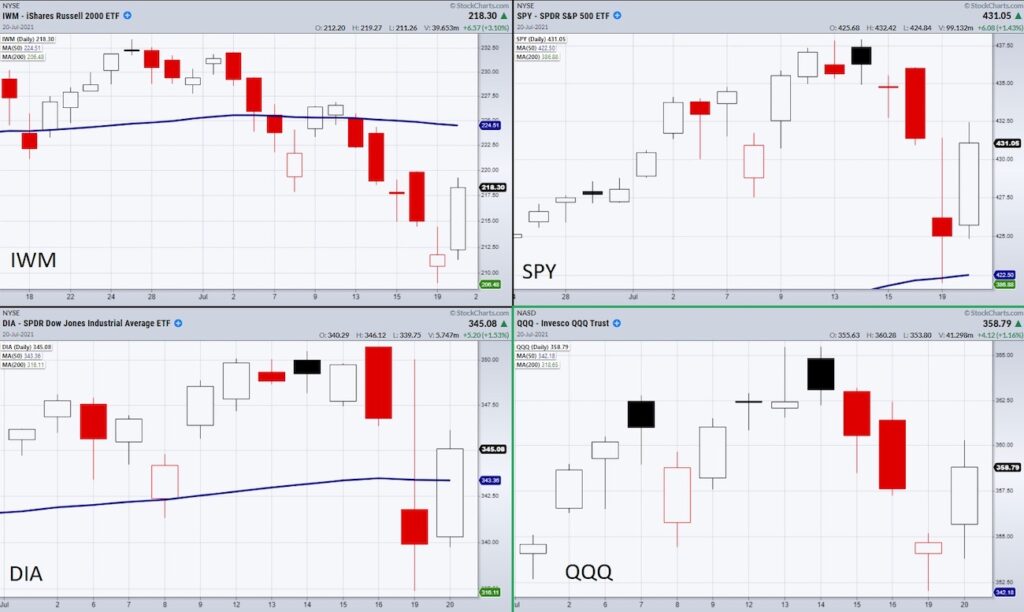
Tuesday the 4 major indices confirmed a reversal pattern with a close over the prior day’s high.
In the above chart you can see all four indices created a new support level that needs to hold based on Monday’s low.
Having said that, we can now look for similar chart patterns to base our trades from.
Additionally, the recent reversal pattern will make it easy to spot weak companies allowing us to focus on only the ones that offer the best opportunities for a winning trade.
The first symbol is Uber (UBER). This had a clear reversal pattern and can be traded with risk under $44.44 (Monday’s low).
Additionally, Uber sits within the back to normal/pre-pandemic trend which has been a major focus of the Fed’s support throughout the year.
Petco (WOOF) is another company that has a clear reversal pattern. If Woof holds its pattern, we will look for this push towards a profit target close to the 50-DMA moving average at $22.80.
Looking into the crypto space, Silvergate Capital Corp (SI) pairs not only a reversal pattern with a break over its 200-DMA at $88.81, but it also reported 4.3 billion dollars’ worth of deposits into its banking platform over the last quarter.
SI’s caveat is Tuesday’s large candle range has made it tough to pick an entry point leaving traders to either watch for a dip lower or to take a more active trade based on a breakout over its next resistance zone created from the 50-DMA at $102.18.
Overall, looking for clear chart patterns based on the recent 2 days pattern has created many opportunities, given the market holds over Monday’s low in the major indices.
Watch Mish run through the Economic Modern Family. From Small Caps, to Bonds, to Bitcoin, she delivers timely information keeping you on the right side of the trend:
Stock Market ETFs Trading Analysis and Summary:
S&P 500 ETF (SPY) New price support at 426.71.
Russell 2000 ETF (IWM) 209.05 is price support.
Dow Jones Industrials ETF (DIA) 337.38 is new price support. Like to see this stay over 344.
Nasdaq 100 ETF (QQQ) 352.04 is price support.
KRE (Regional Banks ETF) price support is at 59.14 (the 200-day moving average).
SMH (Semiconductors ETF) needs to stay over 248.21.
IYT (Transportation ETF) needs 251.78 to hold.
IBB (Biotechnology ETF) 165.80 is price resistance.
XRT (Retail ETF) needs to stay over 94.40 (the 50-day moving average).
Twitter: @marketminute
The author may have a position in mentioned securities at the time of publication. Any opinions expressed herein are solely those of the author and do not represent the views or opinions of any other person or entity.


