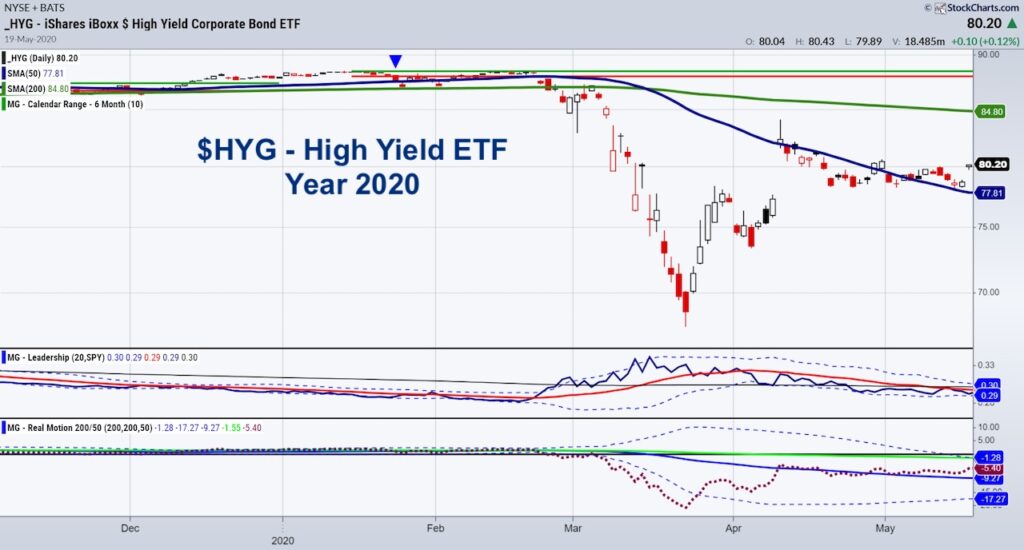
I first became interested in junk bonds right before COVID hit in January 2020.
Note the price at the time of HYG was around 88.50.
Since HYG represents high yield/high debt companies that pay well in a risk on environment, what struck me in early 2020 was that HYG could not clear the horizontal green line or the top of the January 6-month calendar range high.
Then, at the end of January, or where the blue arrow is pointing on the chart, HYG broke the January 6-month calendar range low and the 50-DMA (blue) but held the 200-DMA (also in green).
In February, HYG tried a few more times to clear the January highs and could not.
When I saw HYG break below the 200-DMA at the end of February 2020, I started to pay attention.
As you can see, in March and with the news of Covid, mostly everything got hit hard.
That spectacular drop in HYG happened ahead of the news and ahead of the rest of the market’s drop.
Risk-off was glaring.
Once April began, HYG cleared back over the 50-DMA (blue) signaling to us the coast was clear to get back into equities.
What should we watch for now?
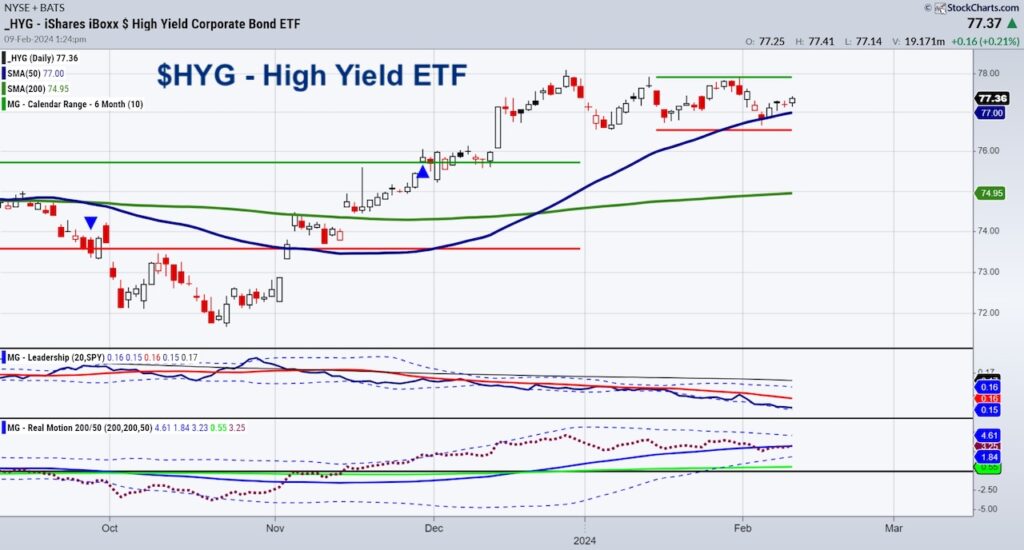
Present time
We all know how spectacular this rally has been to date.
Not only do we see new highs nearly every day in QQQ DIA and SPY, BUT the AI craze ALSO keeps elevating everyone’s mood and risk appetite.
Small caps are trying hard to clear back over 200 (IWM).
The long bonds are showing that rates have peaked but not necessarily going down anytime soon.
So, I have once again four years later, become extremely focused on how HYG is doing and will do.
Like early 2020, HYG has yet to take out its January 6-month calendar range high, while NASDAQ SPY and DIA have.
As we are almost halfway through February, HYG is acting stronger than it did in February 2020.
However, there are some warning signs to watch.
- The price is in the middle of the January range which could mean we see HYG catch up to QQQ and risk remains on. But it could also mean HYG breaks the January lows.
- HYG sits on the 50-DMA but has yet to leave a lot of distance between price and the moving average.
- HYG well underperforms SPY in the Leadership indicator. This means that the money flow is not necessarily going towards a sustained risk-on environment. Rather, it illustrates the concentration of how few stocks are participating in this rally, while junk bonds traders are more cautious.
- The Real Motion or momentum indicator is in a bit of a bearish divergence to price. With momentum under the 50-DMA, any further weakness in price could see momentum decline more sharply.
The bottom line is that we do not see the glaring warning in HYG at this time as we did in 2020.
Nonetheless, we see a bigger reason to watch junk bonds just as we did in 2020.
This type of underperformance, if leads to a break of the January calendar range or a phase change to caution, will give us a head’s up to also be more cautious at the very least.
Then, we can take it from there.
Twitter: @marketminute
The author may have a position in mentioned securities at the time of publication. Any opinions expressed herein are solely those of the author and do not represent the views or opinions of any other person or entity.

 and Semiconductors (SMH): Concerning Price Pattern?")

 and Semiconductors (SMH): Concerning Price Pattern?")


