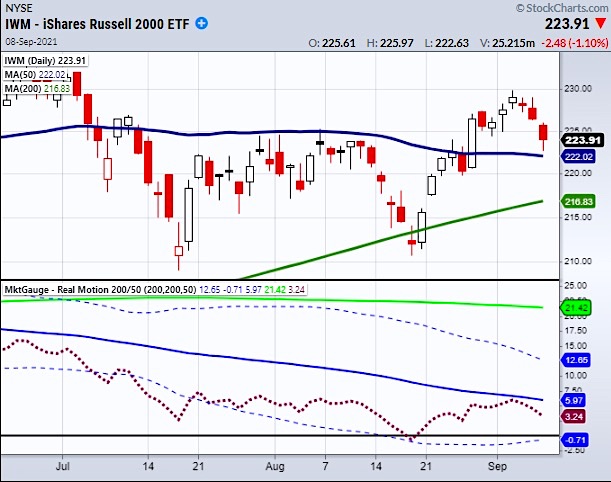
Representing 2000 small-cap companies, the Russell 2000 (IWM) gives a great view of the overall market picture.
Recently we talked about watching our Real Motion momentum indicator to time a buy entry if it cleared its 50-Day moving average in both price and momentum.
However, momentum was unable to clear the MA and has now begun to slope downward.
Now both price and momentum sit in a pivotal area with price holding over main support and RM heading lower.
Looking forward, if the price does not confirm with IWM’s downward momentum we should watch carefully as we are on the fence with a buy opportunity on one side and a cautionary signal on the other.
Looking at the above chart of IWM, the price is holding over the 50-DMA (blue line) at $222. This is the main support that needs to hold through Thursday’s trading session.
If IWM breaks under $222 and closes it will show a breakdown in price and in Real Motion (maroon dots) which is also under its 50-DMA. This would give a cautionary signal since both RM and price agree.
On the other hand, if IWM holds over its MA at $222 we could see another boost in momentum pulling it over its 50-DMA. This would be a bullish signal and could give us a reason to look for buying opportunities.
Therefore, we should keep both scenarios in mind as we are sitting in a pivotal spot.
The last thing we should note is that IWM’s current price area has been very choppy. This means we could see increased volatility as the market battles for direction.
If this is the case, we recommend trading with less capital or waiting to see how the market picture unfolds.
Watch Mish’s recent appearances on Fox News and RT: Boom Bust!
Fox Business Making Money with Charles Payne 9-8-2021
Stock Market ETFs Trading Analysis & Summary:
S&P 500 (SPY) Watching to clear Wednesdays high at 451.67.
Russell 2000 (IWM) Sitting in support area from 222-225.
Dow (DIA) Holding over its 50-DMA at 350.36.
Nasdaq (QQQ) Minor support the 10-DMA at 378.25.
KRE (Regional Banks) Watching for second close under the 50-DMA at 64.18 to confirm a cautionary phase change.
SMH (Semiconductors) 271 support area.
IYT (Transportation) 247.94 main support the 200-DMA.
IBB (Biotechnology) 177.37 high to clear. Held the 10-DMA at 173.52.
XRT (Retail) Needs to get over 97 and hold. 91.49 support.
Twitter: @marketminute
The author may have a position in mentioned securities at the time of publication. Any opinions expressed herein are solely those of the author and do not represent the views or opinions of any other person or entity.


