Both the tech-heavy Nasdaq 100 (QQQ) and the S&P 500 (SPY) sit near their recent breakout levels.
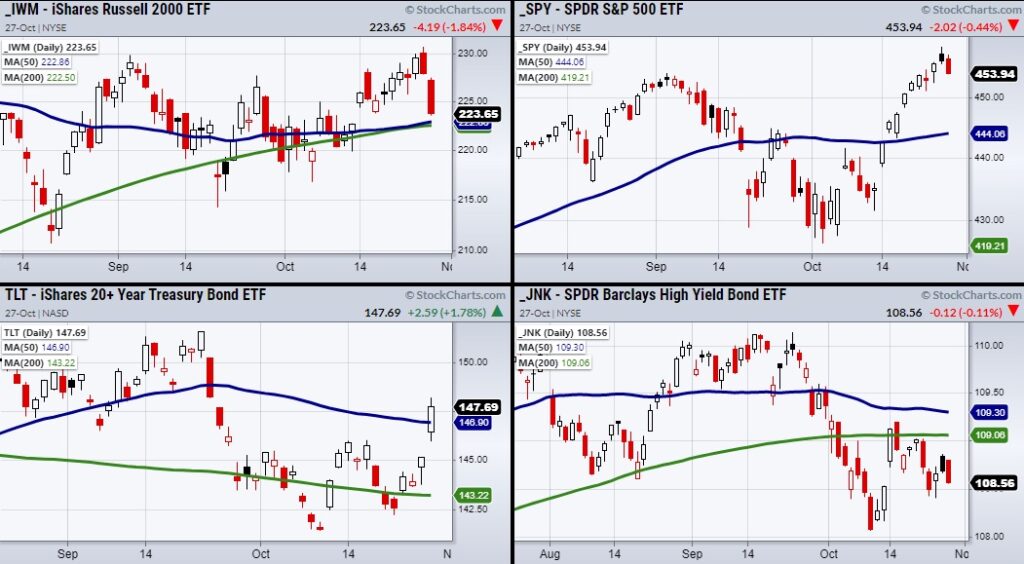
This is a pivotal place for large-cap companies as the small-cap Russell 2000 (IWM) has already given up almost two weeks of progress. Now IWM will look for support from both its 50 and 200-Day moving averages sitting near $222.60.
Although it’s no surprise the Russell 2000 (IWM) was running into major resistance, the recent 2-day selloff shows how large the divergence between large and small-cap companies really are.
With that said, other symbols we watch as risk indictors could be flipping along with IWM.
Wednesday, the 20+ Year Treasury Bonds ETF (TLT) made a huge increase gapping on the market open and clearing over its 50-DMA at $147.06.
Now TLT looks to gain a bullish phase if it can hold over its major moving average on Thursday.
On the other hand, risky High Yield Corporate Debt (JNK) had a small selloff showing that while today’s price action was weaker than expected investors are not running for the exits.
So, what does this mean?
Large-cap and tech stocks steady themselves near highs while small caps retreat into choppy territory losing their upward momentum.
Additionally, investors are buying into the safety of long-term bonds but have yet to completely give up on risky investments with JNK.
Looking at other safety plays such as Silver (SLV) and Gold (GLD), we can see that each is holding over pivotal moving averages.
SLV is above the 10-day moving average at $22.16 and GLD is over the 200-day moving average at $167.97.
The rest of the week will likely have higher volatility as investors are posed with contradictory information.
However, since we are near highs in QQQ and SPY, we have clear levels to watch for a breakout or breakdown from.
Watch Mish’s latest appearance on Fox Business!
Stock Market ETFs Trading Analysis:
S&P 500 (SPY) 454.05 is a pivotal trading area.
Russell 2000 (IWM) 222.60 is key price support area.
Dow Jones Industrials (DIA) 10-day moving average offers minor support at 354.78
Nasdaq (QQQ) 382.78 is key resistance area.
KRE (Regional Banks) 67.14 is the next support area.
SMH (Semiconductors) 262.60 is the main support area.
IYT (Transportation) 263.82 is the next support area.
IBB (Biotechnology) failed to hold the 200-day moving average at 160.30
XRT (Retail) 90.86 is the next support.
Twitter: @marketminute
The author may have a position in mentioned securities at the time of publication. Any opinions expressed herein are solely those of the author and do not represent the views or opinions of any other person or entity.


