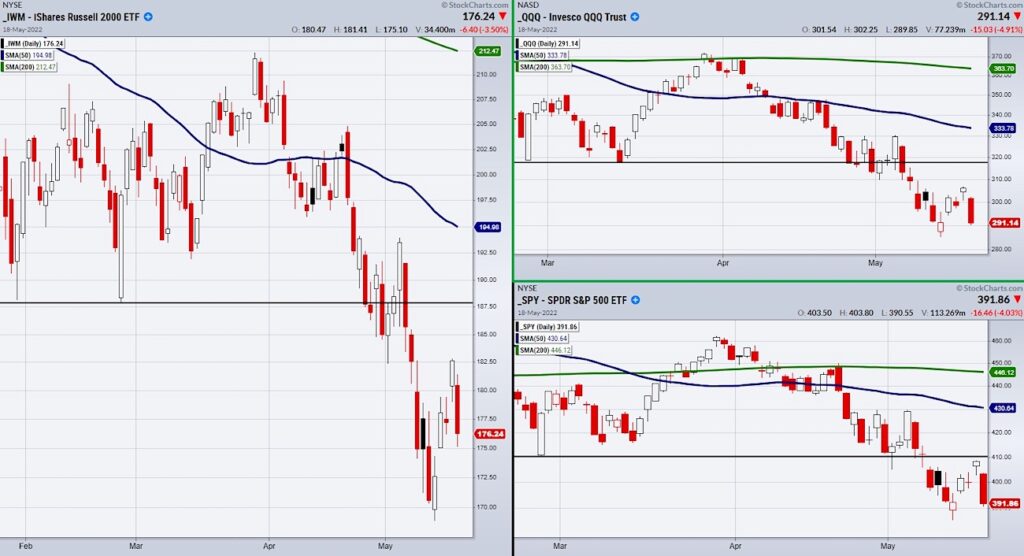
The Rally failed to carry the major indices past key resistance levels.
This can be seen in the above chart of the S&P 500 (SPY), Nasdaq 100 (QQQ), and the Russell 2000 (IWM).
Lines are drawn for previous support levels that once broken turned into important resistance points for each index to clear.
However, this short-term rally failed to even test these levels showing that the weakness of the market remains stronger than some had expected.
With that said, we avoided loading up on equities due to this one symbol that failed to show a buying signal.
Recently, we talked about watching 20+ year bonds ETF (TLT) and High yield corporate debt ETF (JNK) for an indication of market strength or weakness.
While TLT gapped lower on Tuesday showing potential strength in the market, it did not continue to sell off through the day.
However, JNK proved its worth by showing the market’s continued weakness as investors were not interested in buying risky corporate debt even while the indices were trending higher.
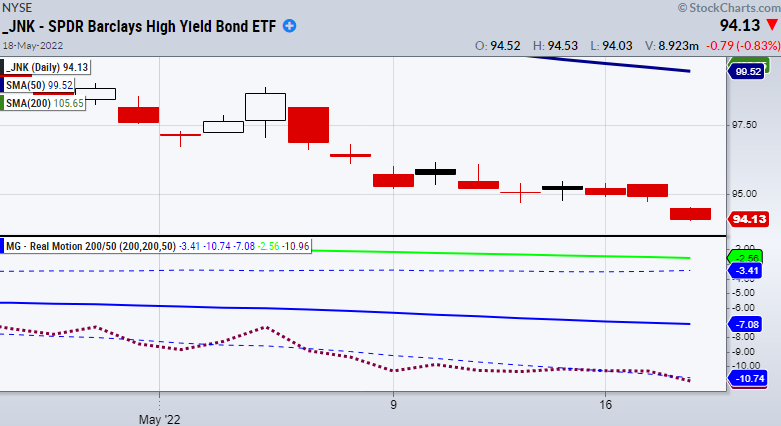
Additionally, in the above chart, we can also see that our RealMotion (RM) indicator is sitting on the lower band and did not make any meaningful move when compared to price.
When looking at our RM momentum indicator, it can help identify hidden momentum when compared to price.
However, RM along with price continued to break down thus showing buying interest in the market was waning even through the recent runup in the major indices.
With that said, if the market continues to break down, next we can watch for recent index lows to hold or break.
Watch Mish’s latest appearance on Fox Business with Charles Payne!
Stock Market ETFs Trading Analysis & Summary:
S&P 500 (SPY) 385 low to watch.
Russell 2000 (IWM) 168 area to watch for support.
Dow (DIA) Will probably break 312 support area.
Nasdaq (QQQ) 285 area to hold.
KRE (Regional Banks) support 58.75
SMH (Semiconductors) 215 support.
IYT (Transportation) Watching for 223 to break.
IBB (Biotechnology) Holding up well for Wednesday’s selloff.
XRT (Retail) Retail was hit the hardest of Mish’s Economic Modern Family on Wednesday.
GLD (Gold) 171.48 the 200-DMA to clear.
USO (oil) Failed the 10-DMA. Watching the 50-DMA next at 76.85
DBA (Agriculture) Watching to fill the gap at 22.19
Twitter: @marketminute
The author may have a position in mentioned securities at the time of publication. Any opinions expressed herein are solely those of the author and do not represent the views or opinions of any other person or entity.


 Ready To Break Out?")


