Precious metals gold and silver (and others) have been very bullish over the past year.
And pullbacks and corrections are common in bull markets.
The latest exhaustion spike and reversal in silver (and reversal in gold) appear to be signaling that a correction is in the cards.
Perhaps even a multi-week pullback that will give brave bulls an opportunity to enter at lower prices.
Today, we look at a chart of the Gold-Silver Index $XAU (INDEXNASDAQ: XAU) to highlight a composite price and sentiment of the pair of precious metals.
Note that the following MarketSurge charts are built with Investors Business Daily’s product suite.
I am an Investors Business Daily (IBD) partner and promote the use of their products. The entire platform offers a good mix of tools, education, and technical and fundamental data.
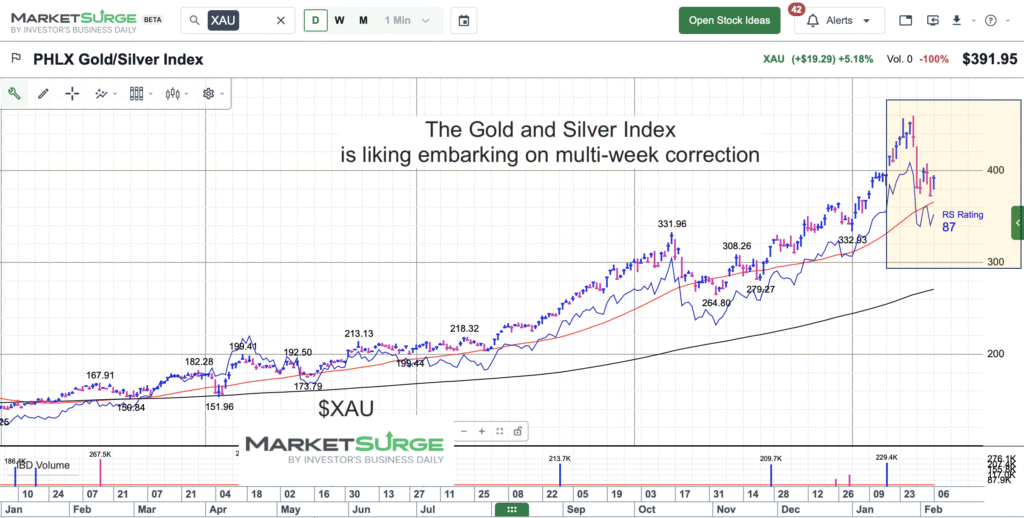
$XAU Gold-Silver Index Chart
While gold and silver charts need to be analyzed separately, $XAU gives us a glimpse at the composite of price and sentiment to offer trends and approximate timing for the sector. Here we can see the strong bearish price reversal. Similar to October, this appears to be shaping up as multi-week correction. Due to the severity of the initial thrust lower, it may even lead to a larger pullback. A 50 percent pullback targets $360, while a 61.8% pullback targets $340. Again, this is a composite index so you’ll need to look at the metals individually. BUT, this gives an idea of where the composite may need to fall before both are “right” again.
Twitter: @andrewnyquist
The author may have a position in mentioned securities at the time of publication. Any opinions expressed herein are solely those of the author, and do not in any way represent the views or opinions of any other person or entity.


