The latest leg higher for the bull market has been supported by a resilient U.S. economy that continues to climb a wall of worry.
And that theme has carried over to the stock market. This has helped stocks rise over 20 percent in 2019.
One core piece of the economy is the housing market. This shows up in sector ETFs like the Homebuilders (XHB).
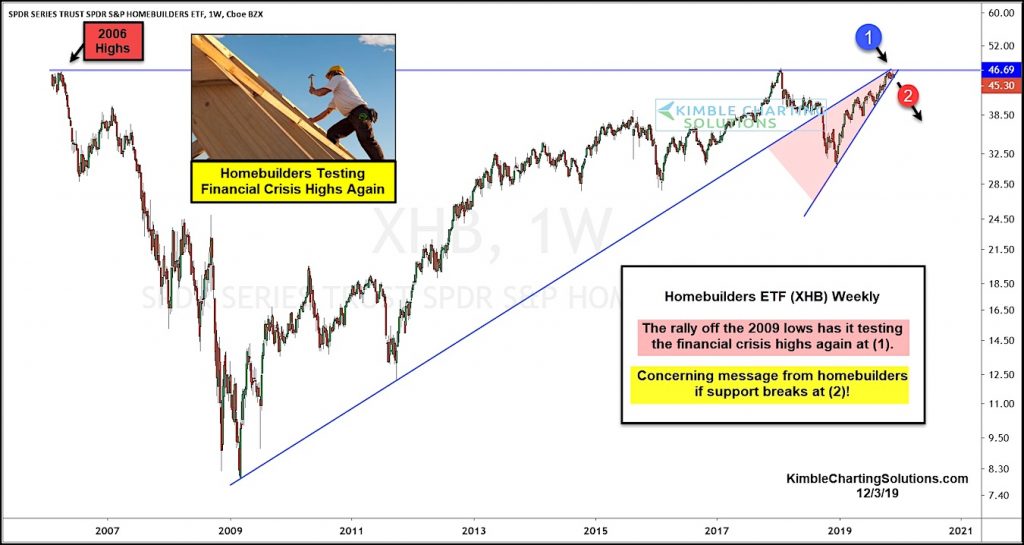
After retesting the 2006 pre-financial crisis highs in early 2018, the Homebuilders fell sharply over throughout the year. But 2019 has been a different story (see chart below).
The rally in 2019 has helped the broader stock market move higher, and has the Homebuilders testing their financial crisis highs once again at point (1).
A breakout here would send a strong bullish message… but the pattern is that of a rising wedge, which can be quite bearish if trend-line support is broken.
If support breaks at point (2), the Homebuilders (XHB) would send a concerning message to the sector, economy, and the broader stock market.
Homebuilders ETF (XHB) “Weekly” Chart
Note that KimbleCharting is offering a 2 week Free trial to See It Market readers. Just send me an email to services@kimblechartingsolutions.com for details to get set up.
Twitter: @KimbleCharting
Any opinions expressed herein are solely those of the author, and do not in any way represent the views or opinions of any other person or entity.


: Showing Some Signs of Emerging Strength")
