Is 2018-2019 going to be a repeat of the 2007-2008 crisis for the home builders?
One indicator / index to watch is the Dow Jones Home Construction Index.
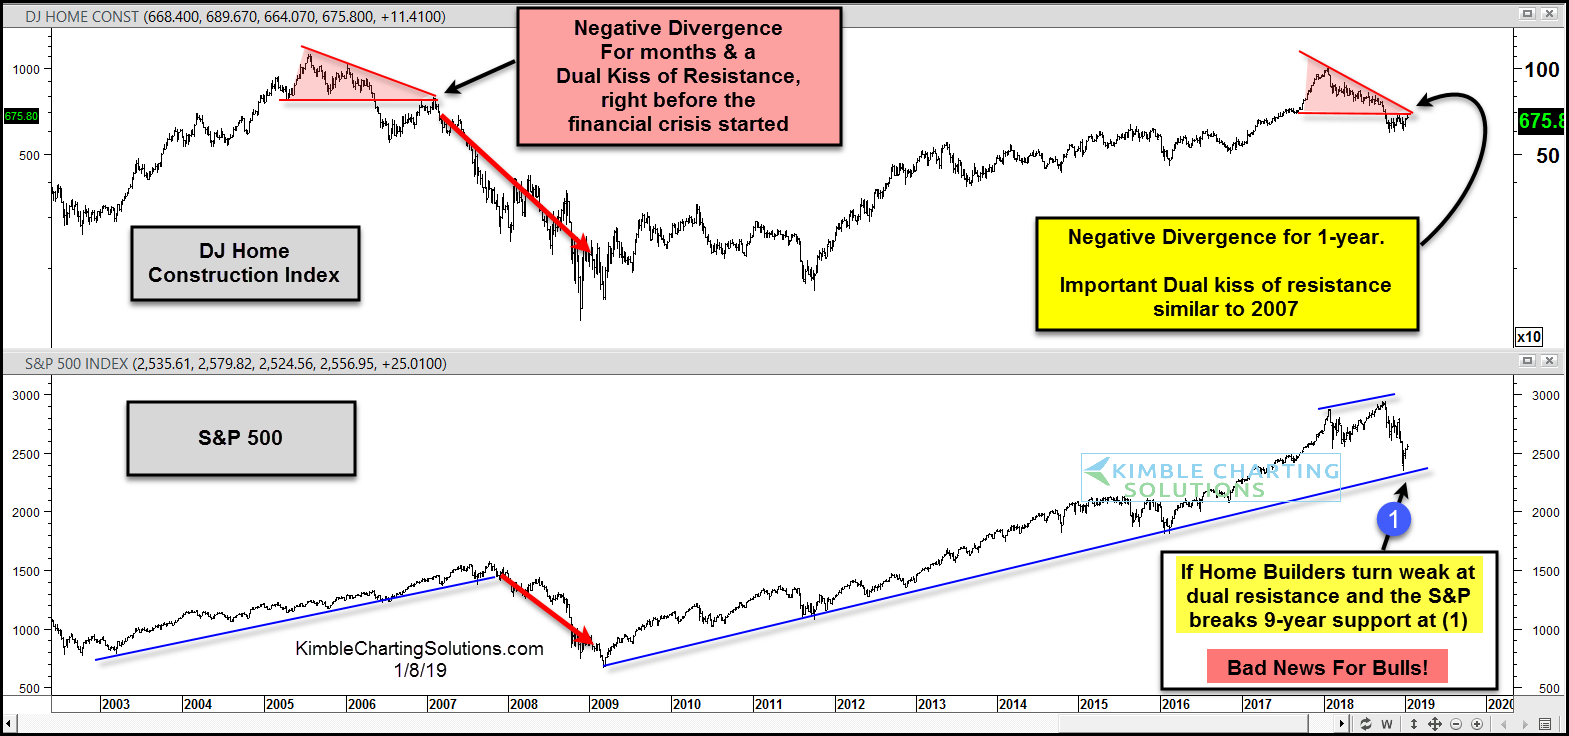
This index experienced a bearish divergence just before the 2007 stock market highs. Once it kissed the underside of dual resistance and turned lower, the financial crisis was underway.
The Home Construction Index is experiencing another bearish divergence that’s developed over the past year. And it is now kissing the underside of dual resistance, similar to the pattern in 2007.
Should this key home building index turn lower here and the S&P 500 break support at (1) it would mean bad news for market bulls.
Pay attention in the weeks ahead!
Dow Jones Home Construction Index Chart
You can also follow the S&P Homebuilders ETF (XHB) and the Home Construction ETF (ITB).
Note that KimbleCharting is offering a 2 week Free trial to See It Market readers. Just send me an email to services@kimblechartingsolutions.com for details to get set up.
Twitter: @KimbleCharting
Any opinions expressed herein are solely those of the author, and do not in any way represent the views or opinions of any other person or entity.


