The following research was contributed to by Christine Short, VP of Research at Wall Street Horizon.
Executive Summary
– A “SMID” cap focused on supply chain solutions is featured with unusual earnings next week
– Traders should monitor the latest sales data from retailers; we profile a fashion brand with interim results to be released Wednesday
– Consumer shopping in Europe is low compared to the US
Earnings Outlier
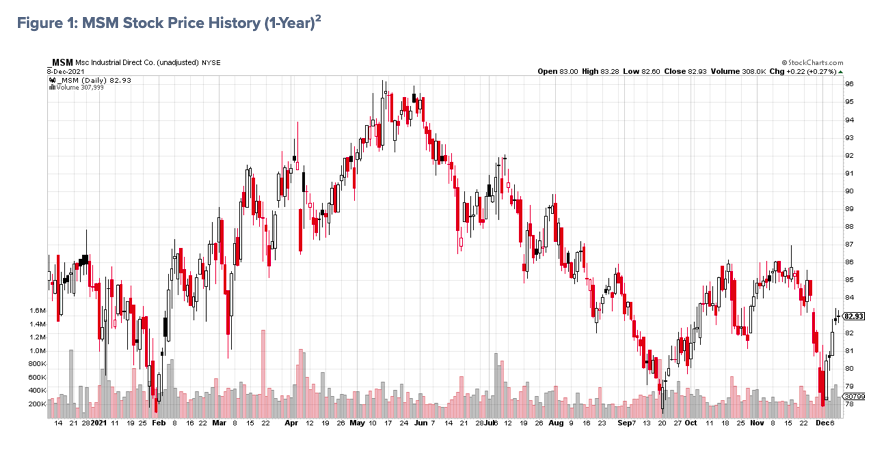
MSC Industrial Direct Co (MSM) stands out with a much earlier than usual earnings date. This $4.6 billion market cap is found in many of popular small and mid-cap exchange-traded funds (ETFs) and dividend-focused ETFs. This Industrials sector SMID cap sports a lofty yield of 3.6%, more than twice that of the S&P 500.
Hurt by Supply Chain Issues?
Many investors might not know about this New York-based firm listed on the Russell 1000 index. MSM is a leading North American distributor of metalworking and maintenance, repair, and operations products and services. The 75-year-old company offers inventory management and other supply chain solutions for capital-intensive businesses.¹ It’s no doubt that this niche of the U.S. economy has felt the brunt of supply chain backlogs this year. Indicators now suggest supply chain woes are easing, which might bode well for MSM.
An Underperformer
Investors in MSM have been disappointed in 2021. The stock price generally rallied through May, moving from under $80 in January to $96 at the year’s peak. A dismal June and third quarter resulted in a nearly 20% drawdown. Traders bullish MSM are hopeful that a double-bottom was put in last month. Still, MSM has underperformed the S&P 500 and Industrials sector this year. Will an unusual earnings report help to turn things around?
Outlier Analysis
MSM has historically reported Q1 earnings between January 6 and January 11 with a strong Wednesday trend.
- On October 21, Wall Street Horizon set an Unconfirmed earnings date of January 5 BMO based on that trend.
- On November 19, however, MSM announced via press release that it would report on December 22 BMO Confirmed.
This much earlier than normal earnings date resulted in an enormous Z-score of –14. That is among the largest deviations from the norm that we have seen this earnings period. An earlier than usual earnings date often indicates good news will be announced. Traders should mark their calendars for this earnings outlier during the holiday-shortened week.
Interim Data
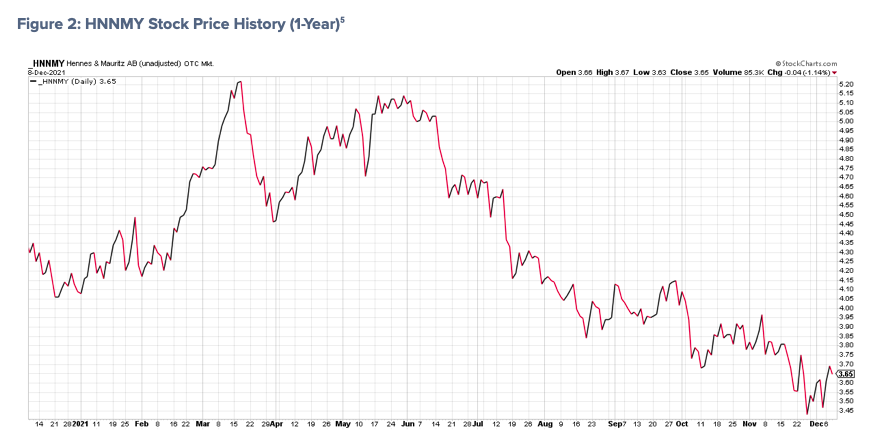
H&M Hennes & Mauritz (HNNMY) reports sales development data for the September through November period on Wednesday, December 15.³ H&M is a popular clothing retailer based in Stockholm, Sweden. The company engages in the sale of clothing, footwear, cosmetics, and home textiles within the Consumer Discretionary sector. It also offers accessories, underwear, sportswear, and other apparel for men, women, and kids.⁴ This is a critical time of the year for retailers, and investors have turned sour on this particular stock.
European Retailers Under Pressure
Shares of H&M, listed both on the Stockholm Stock Exchange and as an OTC equity in the U.S., have dropped sharply from a high above $5 last March to under $3.50 in late November. While domestic consumers are spending at a torrid clip, shoppers overseas have been less aggressive. Will European retailers turn things around? Wednesday’s interim sales data could provide clues.
Looking ahead, H&M reports full-year results on January 28—covering the December 2020 through November 2021 period. The next interim sales report will be issued on March 15.
Conclusion
All eyes are on holiday sales reports and foot-traffic data as the heart of consumer spending season continues. While it’s often a cheery time on Wall Street heading into year-end, traders must still monitor important corporate events and signaling from executives. Managing risk can be even more important around holidays—just look at what happened on Black Friday across global markets. Wall Street Horizon provides traders with the tools necessary to effectively manage risk and volatility.
For more information on the data sourced in this report, please email: info@wallstreethorizon.com
Wall Street Horizon provides institutional traders and investors with the most accurate and comprehensive forward-looking event data. Covering 9,000 companies worldwide, we offer more than 40 corporate event types via a range of delivery options from machine-readable files to API solutions to streaming feeds. By keeping clients apprised of critical market-moving events and event revisions, our data empowers financial professionals to take advantage of or avoid the ensuing volatility.
Sources:
¹ https://www.mscdirect.com/corporate/about-msc
² https://stockcharts.com/h-sc/ui?s=_MSC&p=D&yr=1&mn=0&dy=0&id=p31766206068
³ https://hmgroup.com/investors/financial-calendar/
⁴ https://hmgroup.com/about-us/
⁵ https://stockcharts.com/h-sc/ui?s=_HNNMY&p=D&yr=1&mn=0&dy=0&id=p48385354994

Christine Short, VP of Research at Wall Street Horizon, is focused on publishing research on Wall Street Horizon event data covering 9,000 global equities in the marketplace. Over the past 15 years in the financial data industry, her research has been widely featured in financial news outlets including regular appearances on networks such as CNBC and Fox to talk corporate earnings and the economy.

: Worrisome to Broader Market?")
